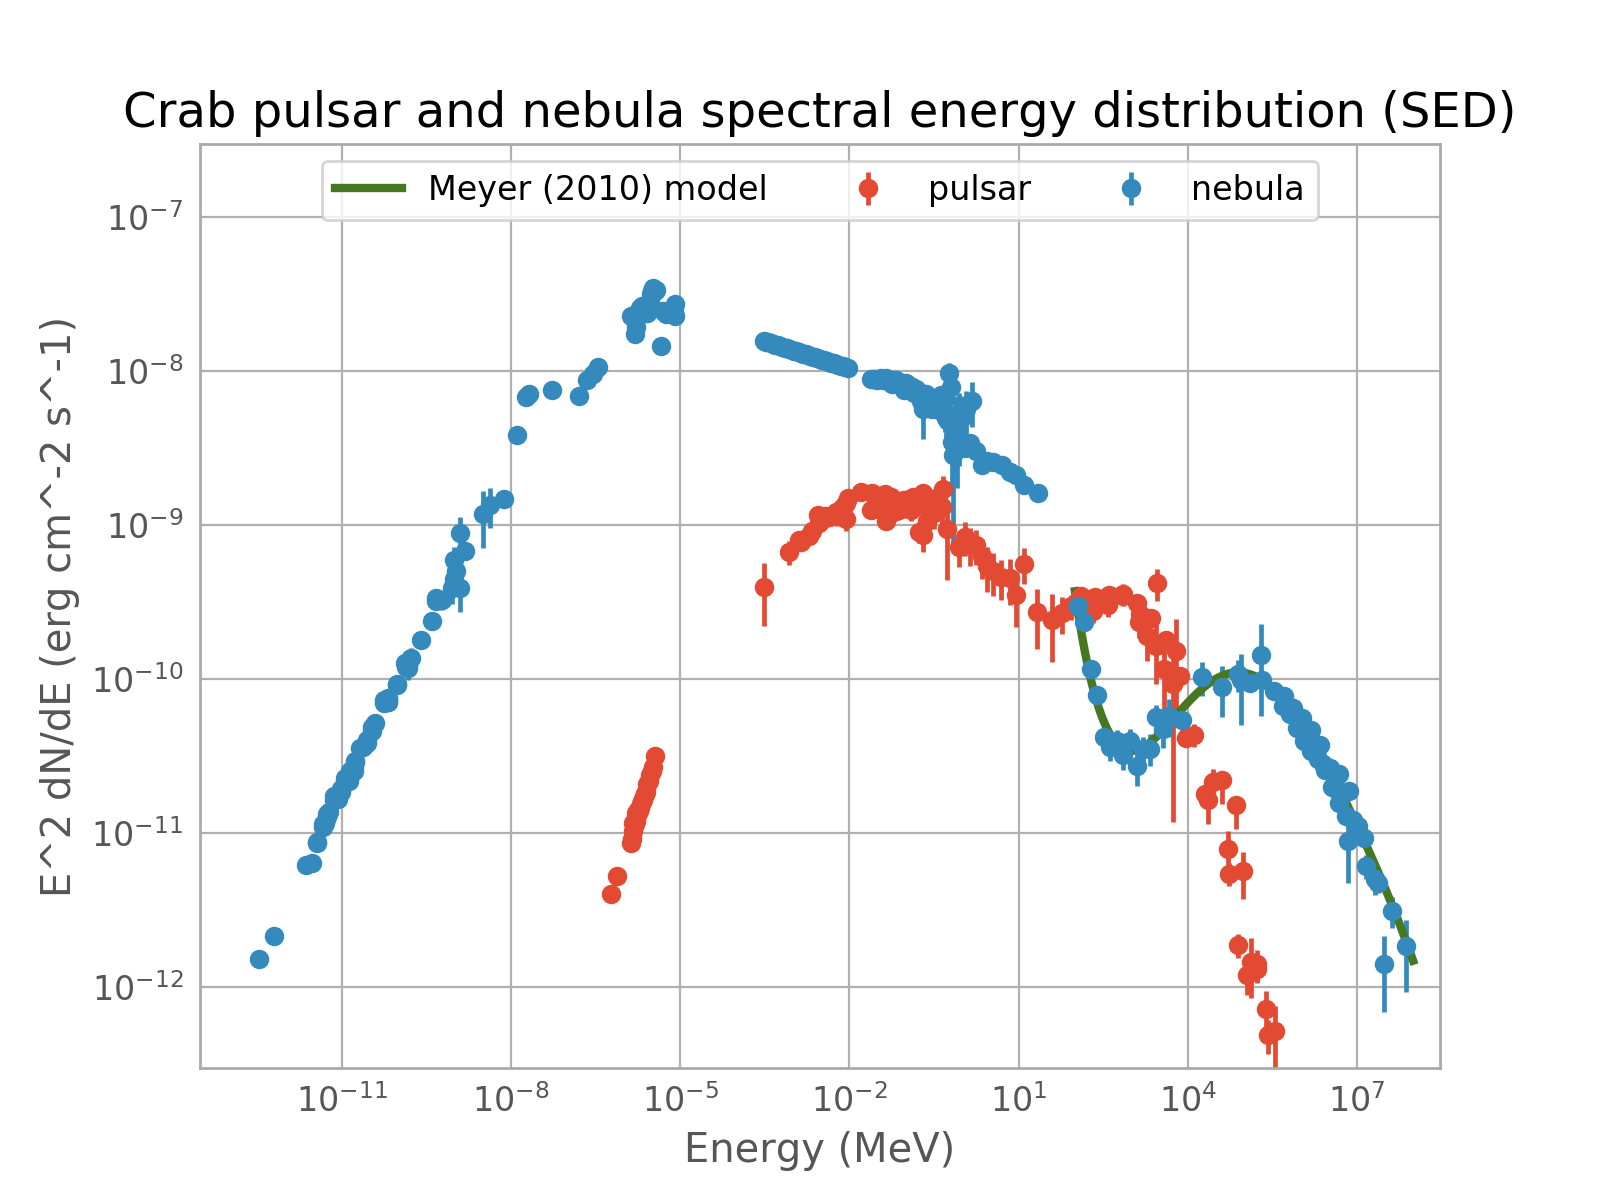
Crab multi-wavelength SED
Here we load Crab pulsar and nebula flux points gammapy.datasets.load_crab_flux_points
TODO:
- describe data and emission components
- perform fit with
naima!
"""Plot Crab pulsar and nebula spectral energy distribution (SED)."""
import numpy as np
import matplotlib.pyplot as plt
import astropy.units as u
from gammapy.datasets import load_crab_flux_points
from gammapy.spectrum import CrabSpectrum

# Plot flux points
for component in ['pulsar', 'nebula']:
    table = load_crab_flux_points(component=component)
    x = table['energy'].data
    y = table['energy_flux'].data
    yerr_lo = table['energy_flux_err_lo'].data
    yerr_hi = table['energy_flux_err_hi'].data
    plt.errorbar(x, y, yerr=(yerr_lo, yerr_hi), fmt='o', label=component)

# Plot SED model
energy = np.logspace(2, 8, 100) * u.MeV

crab = CrabSpectrum(reference='meyer')

flux = crab.model(energy)
energy_flux = (energy ** 2 * flux).to('erg cm^-2 s^-1')
plt.plot(energy.value, energy_flux.value, label='Meyer (2010) model', lw=3)

plt.title('Crab pulsar and nebula spectral energy distribution (SED)')
plt.xlim((3e-14, 3e8))
plt.ylim((3e-13, 3e-7))
plt.xlabel('Energy (MeV)')
plt.ylabel('E^2 dN/dE (erg cm^-2 s^-1)')
plt.legend(loc='upper center', ncol=3)
plt.grid()
plt.loglog()
plt.savefig('crab_mwl.png')
(Source code, png, hires.png, pdf)
