This is a fixed-text formatted version of a Jupyter notebook.
You can contribute with your own notebooks in this GitHub repository.
Source files: image_analysis.ipynb | image_analysis.py
Image analysis with Gammapy
Introduction
This tutorial shows how to make a significance image of the Crab nebula with Gammapy.
- Use the gammapy.data.DataStore to load gammapy.data.EventList data.
- Fill the events in a gammapy.image.SkyImage
- We’ll use the astropy.convolution.Tophat2DKernel and astropy.convolution.Ring2DKernel kernels and the gammapy.detect.KernelBackgroundEstimator to estimate the background.
- Run gammapy.scripts.StackedObsImageMaker to get images and PSF.
TODO: Refactor
gammapy.scripts.image_fit
into a class (simiar to gammapy.spectrum.SpectrumFit) and run it
here to fit a Gauss and get the position / extension.
Setup
As usual, IPython notebooks start with some setup and Python imports
In [1]:
%matplotlib inline
import numpy as np
import matplotlib.pyplot as plt
In [2]:
import astropy.units as u
from astropy.coordinates import SkyCoord
from astropy.convolution import Ring2DKernel, Tophat2DKernel
from astropy.visualization import simple_norm

from gammapy.data import DataStore
from gammapy.image import SkyImage, SkyImageList
from gammapy.detect import KernelBackgroundEstimator as KBE
Dataset
We will use the gammapy.data.DataStore to access some example data.
These are observations of the Crab nebula with H.E.S.S. (preliminary, events are simulated for now).
In [3]:
data_store = DataStore.from_dir('$GAMMAPY_EXTRA/datasets/hess-crab4-hd-hap-prod2/')
Counts image
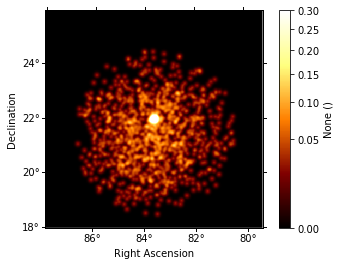
Let’s make a counts image using the SkyMap class.
In [4]:
source_pos = SkyCoord(83.633083, 22.0145, unit='deg')
# If you have internet access, you could also use this to define the `source_pos`:
# source_pos = SkyCoord.from_name('crab')
print(source_pos)
<SkyCoord (ICRS): (ra, dec) in deg
    ( 83.633083,  22.0145)>
In [5]:
ref_image = SkyImage.empty(
    nxpix=400, nypix=400, binsz=0.02,
    xref=source_pos.ra.deg, yref=source_pos.dec.deg,
    coordsys='CEL', proj='TAN',
)
In [6]:
# Make a counts image for a single observation
events = data_store.obs(obs_id=23523).events
counts_image = SkyImage.empty_like(ref_image)
counts_image.fill_events(events)
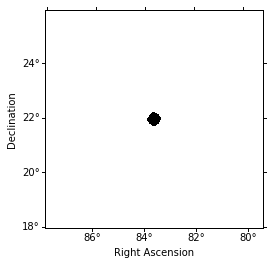
In [7]:
norm = simple_norm(counts_image.data, stretch='sqrt', min_cut=0, max_cut=0.3)
counts_image.smooth(radius=0.1 * u.deg).plot(norm=norm, add_cbar=True)
Out[7]:
(<matplotlib.figure.Figure at 0x107b99b70>,
 <matplotlib.axes._subplots.WCSAxesSubplot at 0x108533d68>,
 <matplotlib.colorbar.Colorbar at 0x102666b00>)
In [8]:
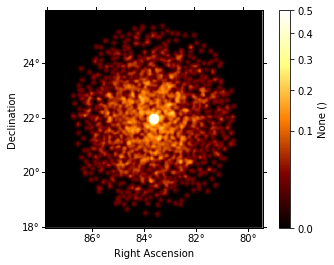
# Making a counts image for multiple observations is a bit inconvenient at the moment
# we'll make that better soon.
# For now, you can do it like this:
obs_ids = [23523, 23526]
counts_image2 = SkyImage.empty_like(ref_image)
for obs_id in obs_ids:
    events = data_store.obs(obs_id=obs_id).events
    counts_image2.fill_events(events)
In [9]:
norm = simple_norm(counts_image2.data, stretch='sqrt', min_cut=0, max_cut=0.5)
counts_image2.smooth(radius=0.1 * u.deg).plot(norm=norm, add_cbar=True)
Out[9]:
(<matplotlib.figure.Figure at 0x107d9c0b8>,
 <matplotlib.axes._subplots.WCSAxesSubplot at 0x108f72710>,
 <matplotlib.colorbar.Colorbar at 0x1093fac50>)
Background modeling
In Gammapy a few different methods to estimate the background are available.
Here we’ll use the gammapy.detect.KernelBackgroundEstimator to make a background image and the make a significance image.
In [10]:
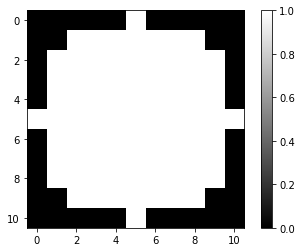
source_kernel = Tophat2DKernel(radius=5)
source_kernel.normalize(mode='peak')
source_kernel = source_kernel.array
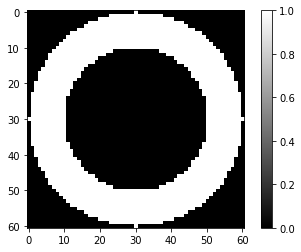
background_kernel = Ring2DKernel(radius_in=20, width=10)
background_kernel.normalize(mode='peak')
background_kernel = background_kernel.array
In [11]:
plt.imshow(source_kernel, interpolation='nearest', cmap='gray')
plt.colorbar()
plt.grid('off')
In [12]:
plt.imshow(background_kernel, interpolation='nearest', cmap='gray')
plt.colorbar()
plt.grid('off')
In [13]:
# To use the `KernelBackgroundEstimator` you first have to set
# up a source and background kernel and put the counts image input
# into a container `SkyImageList` class.
images = SkyImageList()
images['counts'] = counts_image2

kbe = KBE(
    kernel_src=source_kernel,
    kernel_bkg=background_kernel,
    significance_threshold=5,
    mask_dilation_radius=0.06 * u.deg,
)
# This takes about 10 seconds on my machine
result = kbe.run(images)
/Users/deil/code/gammapy/gammapy/stats/poisson.py:237: RuntimeWarning: invalid value encountered in greater_equal
  mask = (n_on >= n_on_min)
/Users/deil/code/gammapy/gammapy/stats/poisson.py:254: RuntimeWarning: invalid value encountered in sqrt
  term_b = sqrt(n_on * log(n_on / mu_bkg) - n_on + mu_bkg)
/Users/deil/code/gammapy/gammapy/detect/kernel.py:188: RuntimeWarning: invalid value encountered in less
  mask = (significance.data < p['significance_threshold']) | np.isnan(significance)
In [14]:
# Let's have a look at the background image and the exclusion mask

# This doesn't work yet ... need to do SkyImage.plot fixes:
# fig, axes = plt.subplots(nrows=1, ncols=3, figsize=(10, 3))
# background_image.plot(ax=axes[0])
# exclusion_image.plot(ax=axes[1])
# significance_image.plot(ax=axes[2])
In [15]:
background_image = result['background']
norm = simple_norm(background_image.data, stretch='sqrt', min_cut=0, max_cut=0.5)
background_image.plot(norm=norm, add_cbar=True)
Out[15]:
(<matplotlib.figure.Figure at 0x1096246a0>,
 <matplotlib.axes._subplots.WCSAxesSubplot at 0x10963b470>,
 <matplotlib.colorbar.Colorbar at 0x108d482b0>)

In [16]:
result['exclusion'].plot()
Out[16]:
(<matplotlib.figure.Figure at 0x109522a20>,
 <matplotlib.axes._subplots.WCSAxesSubplot at 0x108d70780>,
 None)
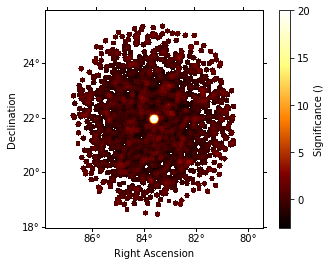
In [17]:
significance_image = result['significance']
significance_image.plot(add_cbar=True, vmin=-3, vmax=20)
Out[17]:
(<matplotlib.figure.Figure at 0x108dd2f98>,
 <matplotlib.axes._subplots.WCSAxesSubplot at 0x109409518>,
 <matplotlib.colorbar.Colorbar at 0x108d73b70>)
Exercises
- Compute the counts, excess, background and significance at the Crab nebula position.
- Make an energy distribution of the events at the Crab nebula position.