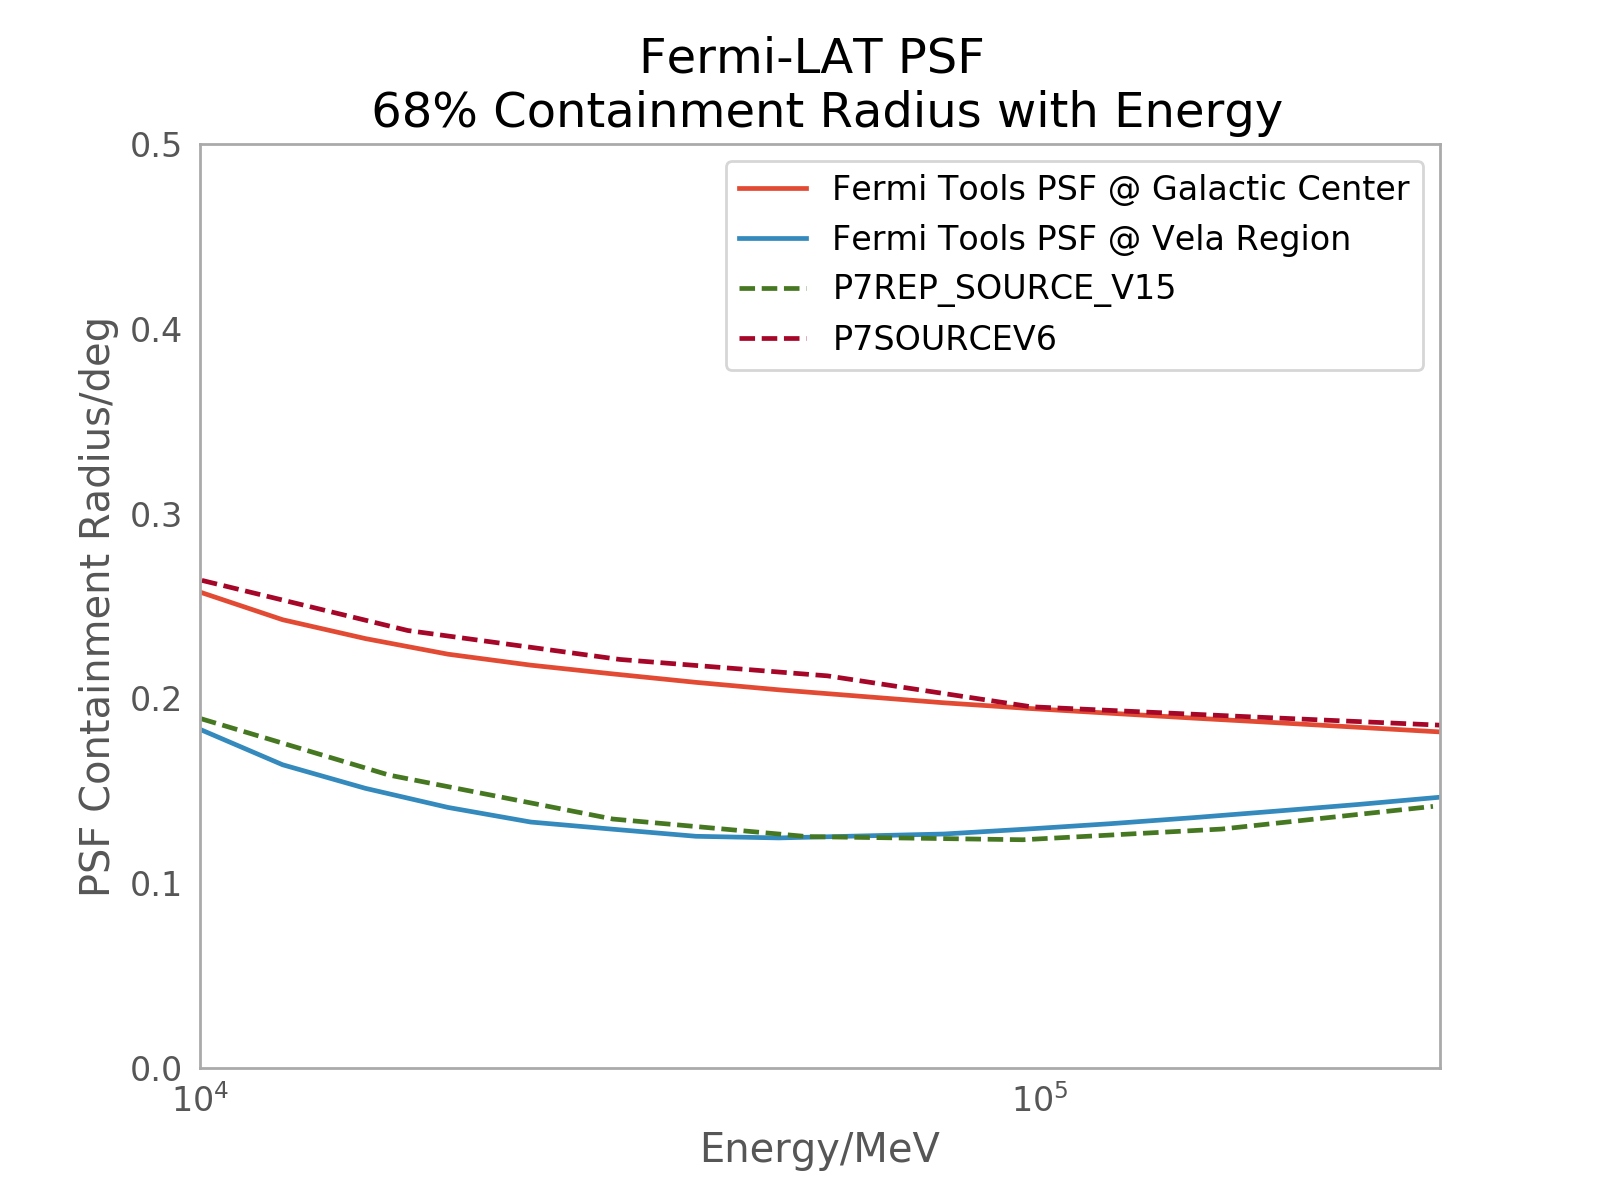
Fermi-LAT PSF Study
This study compares the results of the Fermi Science Tool gtpsf - which gives
information about the size of the Fermi-LAT PSF with energy - for the Galactic
center FermiGalacticCenter and in the region of the
Vela Pulsar FermiVelaRegion. The plots below compare
the PSF calculated using the Science Tools in these locations, and compare
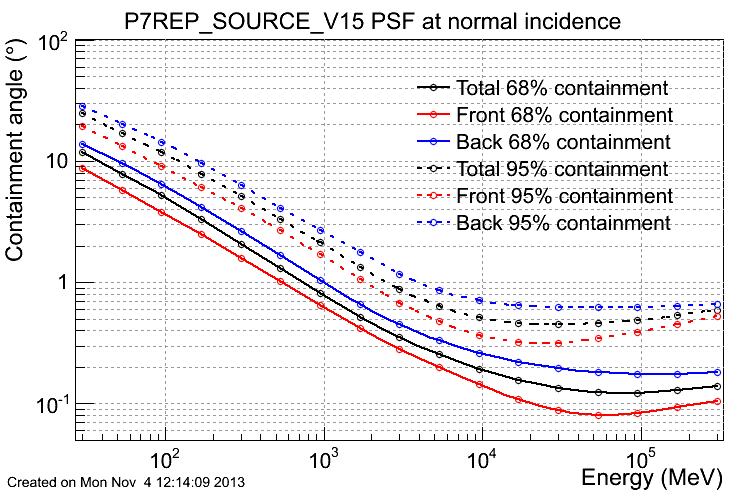
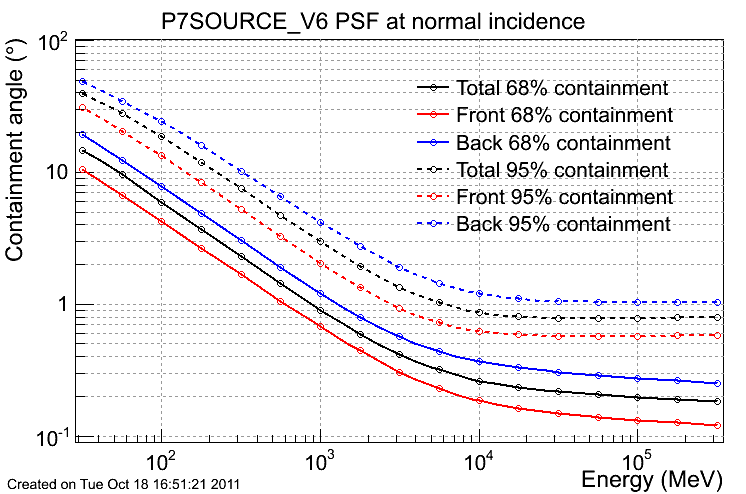
to the published LAT PSF data for Pass 7 P7SOURCEV6 and reprocessed
Pass 7 P7REP_SOURCE_V15 IRFs at energies between 10 and 300 GeV (the range
of energies for which the calculated and published PSF results are all
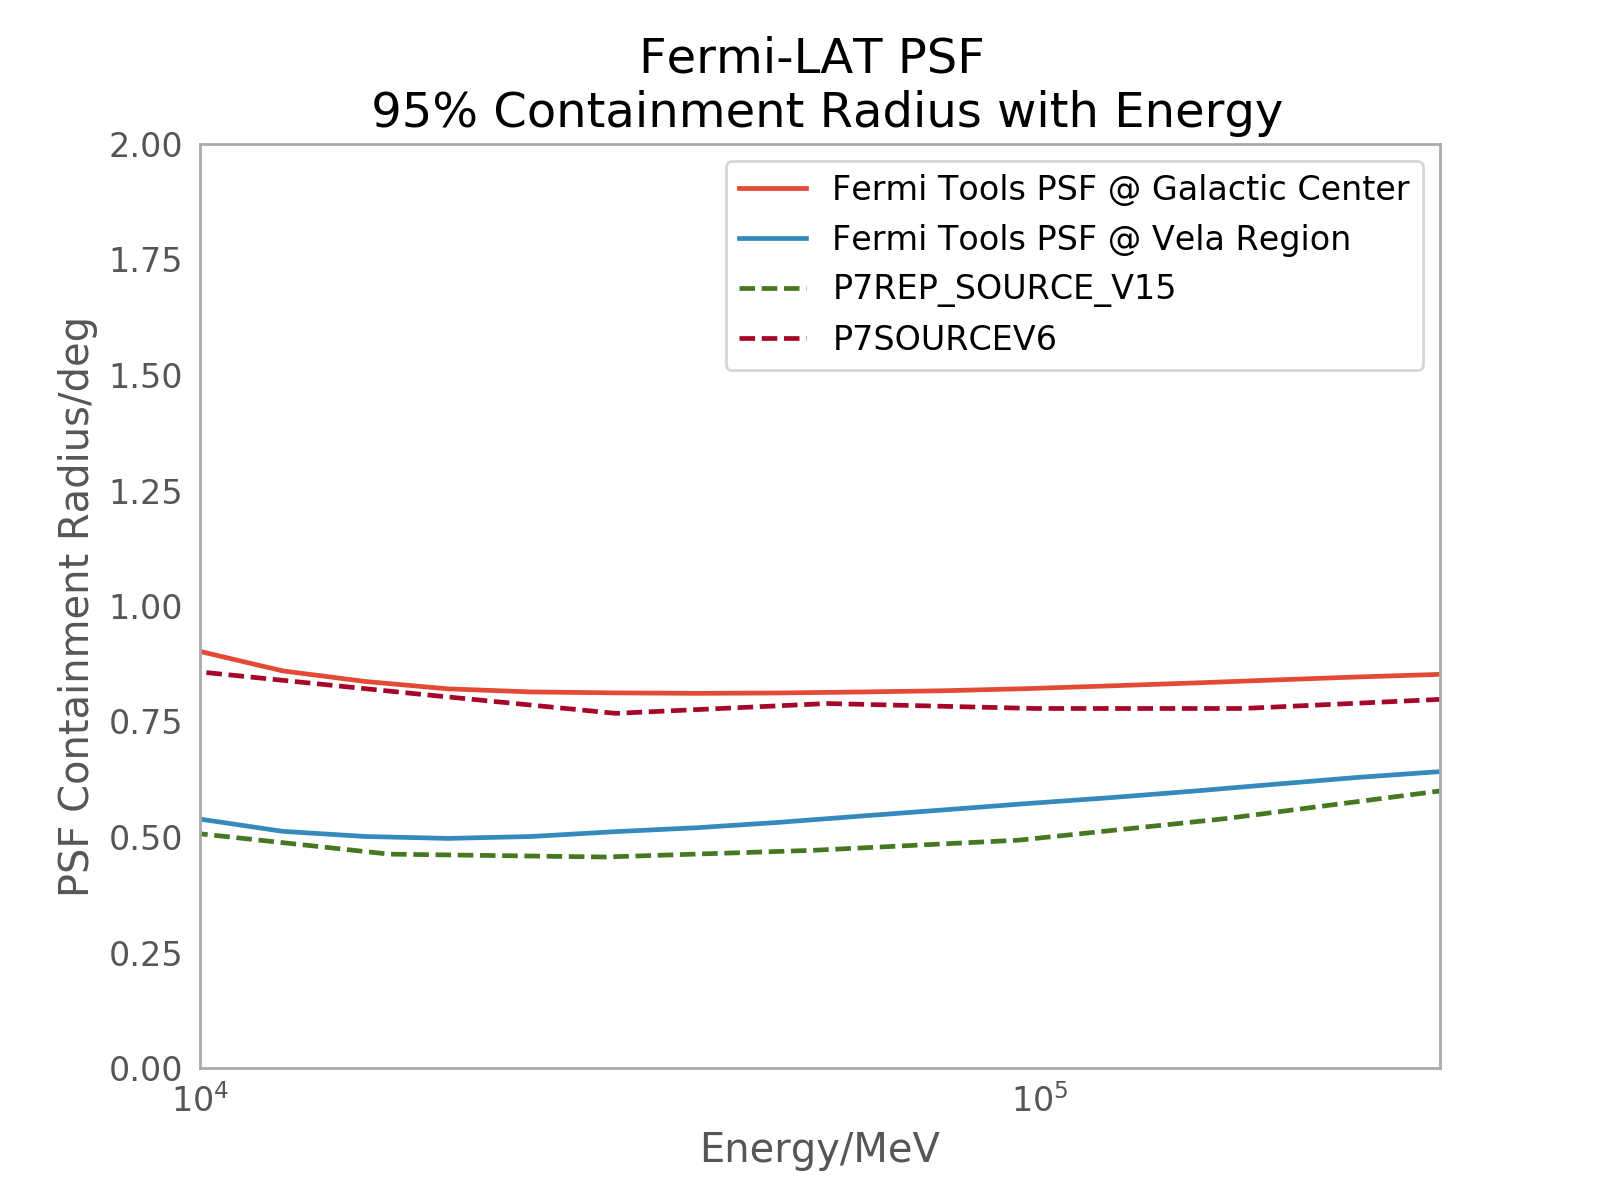
available). 68% and 95% PSF containment radii are considered.
"""Produces table to study the size of the Fermi-LAT PSF with Energy.
"""
import matplotlib.pyplot as plt
from astropy.table import Table
from gammapy.utils.energy import EnergyBounds
from gammapy.datasets import FermiGalacticCenter, FermiVelaRegion
from gammapy.datasets import load_lat_psf_performance

__all__ = ['get_psf_table', 'plot_containment_radii']


def get_psf_table(psf, emin, emax, bins):
    """Returns a table of energy and containment radius
    from an EnergyDependentTablePSF object."""

    # Container for data
    data = []

    # Loop over energies and determine PSF containment radius
    ebounds = EnergyBounds.equal_log_spacing(emin, emax, bins, 'MeV')
    for energy in ebounds:
        energy_psf = psf.table_psf_at_energy(energy)

        containment_68 = energy_psf.containment_radius(0.68)
        containment_95 = energy_psf.containment_radius(0.95)

        row = dict(ENERGY=energy.value,
                   CONT_68=containment_68.value,
                   CONT_95=containment_95.value)

        data.append(row)

    # Construct table and add correct units to columns
    table = Table(data)
    table['ENERGY'].units = energy.unit
    table['CONT_68'].units = containment_68.unit
    table['CONT_95'].units = containment_95.unit

    return table


def plot_containment_radii(fraction):
    """Plotting script for 68% and 95% containment radii."""

    psf_gc = FermiGalacticCenter.psf()
    gtpsf_table_gc = get_psf_table(psf_gc, 10000, 300000, 15)

    psf_vela = FermiVelaRegion.psf()
    gtpsf_table_vela = get_psf_table(psf_vela, 10000, 300000, 15)

    if fraction == 68:
        true_table_rep = load_lat_psf_performance('P7REP_SOURCE_V15_68')
        true_table = load_lat_psf_performance('P7SOURCEV6_68')
        rad = 'CONT_68'
    elif fraction == 95:
        true_table_rep = load_lat_psf_performance('P7REP_SOURCE_V15_95')
        true_table = load_lat_psf_performance('P7SOURCEV6_95')
        rad = 'CONT_95'

    plt.plot(gtpsf_table_gc['ENERGY'], gtpsf_table_gc[rad],
             label='Fermi Tools PSF @ Galactic Center')
    plt.plot(gtpsf_table_vela['ENERGY'], gtpsf_table_vela[rad],
             label='Fermi Tools PSF @ Vela Region')
    plt.plot(true_table_rep['energy'], true_table_rep['containment_angle'],
             linestyle='--', label='P7REP_SOURCE_V15')
    plt.plot(true_table['energy'], true_table['containment_angle'],
             linestyle='--', label='P7SOURCEV6')

    plt.xlim([10000, 300000])

    plt.legend()
    plt.semilogx()
    plt.xlabel('Energy/MeV')
    plt.ylabel('PSF Containment Radius/deg')

    return plt
Note that for the P7SOURCEV6 and P7REP_SOURCE_V15 lines, the data was
extracted by hand and so a 10% error should be assumed
(Source code, png, hires.png, pdf)
(Source code, png, hires.png, pdf)
The plot for P7REP_SOURCE_V15 is not available online, but P7REP_CLEAN_V15
is very similar to P7REP_SOURCE_V15 which is used for this study.
The plots indicate that P7REP_CLEAN_V15 cuts (which are very similar to
P7REP_SOURCE_V15 cuts) were used for the Vela Region data. However, for
the Galactic Center region, P7SOURCEV6 cuts are consistent with the PSF
data, and P7REP_CLEAN_V15 could not have been used here.
The published LAT PSF data may be found at: