plot_fermi_3fgl_light_curve
-
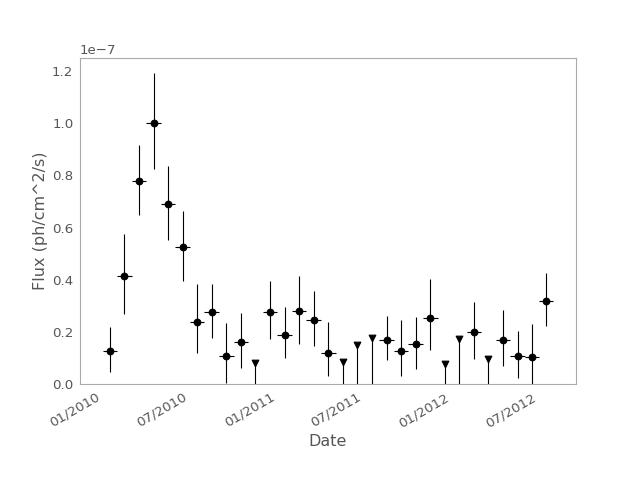
gammapy.time.plot_fermi_3fgl_light_curve(source_name, time_start=None, time_end=None, ax=None)[source]¶ Plot flux as a function of time for a fermi 3FGL object.
Parameters: source_name : str
The 3FGL catalog name of the object to plot
time_start :
Timeor str or NoneLight curve start time. If None, use the earliest time in the catalog.
time_end :
Timeor str or NoneLight curve end time. If None, use the latest time in the catalog.
ax :
Axesor NoneAxes
Returns: ax :
AxesAxes
Examples
Plot a 3FGL lightcurve:
from gammapy.time import plot_fermi_3fgl_light_curve
plot_fermi_3fgl_light_curve('3FGL J0349.9-2102',
                            time_start='2010-01-01',
                            time_end='2015-02-02')

import matplotlib.pyplot as plt
plt.show()
(Source code, png, hires.png, pdf)