Note
You are not reading the most up to date version of Gammapy documentation.
Access the latest stable version v2.0 or the list of Gammapy releases.
Period detection and plotting
Introduction
period establishes methods for period detection in unevenly sampled time series.
It computes the Lomb-Scargle periodogram and the spectral window function on a light curve and
returns the period of the highest periodogram peak as the period of an intrinsic periodic beahviour.
The false alarm probability of this period is estimated under the null hypothesis of only-noise data.
The result can be plotted with plot_periodogram.
The Lomb Scargle algorithm is provided by astropy.stats.LombScargle.
See the astropy docs for more details about the Lomb-Scargle periodogram and its false alarm probability [1].
Getting Started
Input
period takes a light curve in format time, flux and flux error as input.
The trial period grid can optionally be specified by the resolution dt and a maximum period max_period.
If these parameters are not given, dt will be set by the inverse Nyquist frequency and max_period by the length of the light curve.
For the false alarm probability, distributions can be chosen from criteria.
If not specified, all criteria will be used for the analysis.
For the bootstrap resamling, the number of resamlings can be defined by n_bootstrap.
Its default value is set to 100.
plot_periodogram takes the output of period as input.
Output
period returns the period grid, the periodogram peaks of the
Lomb-Scargle periodogram and the spectral window function,
the false alarm probability for the highest periodogram peak for the given criteria,
as well as the period of highest periodogram peak.
Example
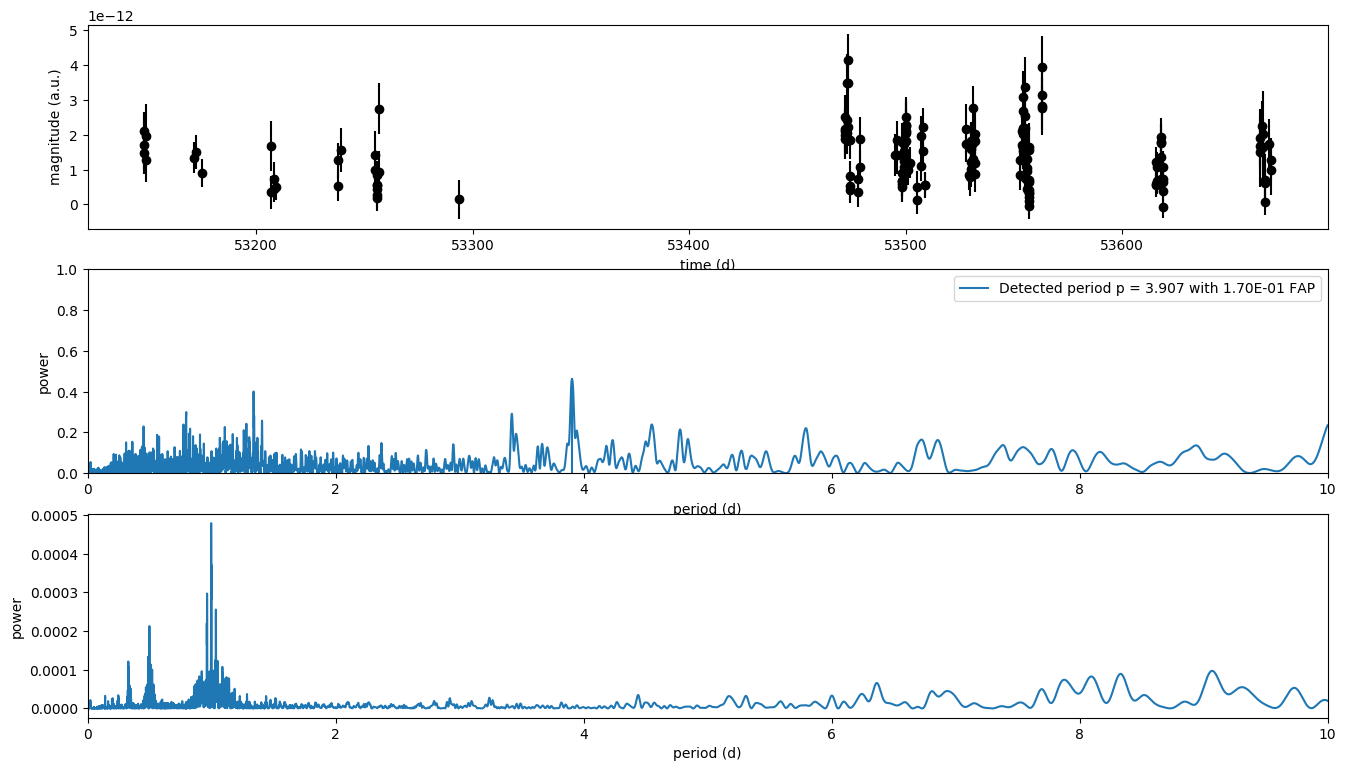
An example of detecting a period is shown in the figure below. The code can be found under [2]. The light curve is from the X-ray binary LS 5039 observed with H.E.S.S. at energies above 0.1 TeV in 2005 [3]. The Lomb-Scargle reveals the period of (3.907±0.001) days in agreement with [3] and [4].

The maximum false alarm probability of the highest periodogram peak is estimated to 0.17 with the cvm criterion.
The false alarm probability (FAP) of all criteria is listed below:
| criterion | FAP |
|---|---|
pre |
1.11e-12 |
cvm |
0.17 |
nll |
0.12 |
boot |
0.0 |
As can be seen, cvm is the most constraining criterion.
boot is to imprecise to return a vaild false alarm probability for 100 bootstrap resamplings.
The parameter max_period was set to 10d to decrease computation time by limiting the period range for the analysis.
The periodogram has many spurious peaks, which are due to several factors:
- Errors in observations lead to leakage of power from the true peaks.
- The signal is not a perfect sinusoid, so additional peaks can indicate higher-frequency components in the signal.
- The spectral window function shows two prominent peaks around one and 27 days. The first one arises from the nightly observation cycle, the second from the lunar phase. Thus, aliases are expected to appear at falias=ftrue+nfwindow for integer values of n. For the peak in the spectral window function at fwindow=1d−1, this corresponds to the second highest peak in the periodogram at palias=0.796.
| [1] | Astropy docs, Lomb-Scargle Periodograms, Link |
| [2] | Gammapy docs, Lomb-Scargle periodogram example, Link |
| [3] | (1, 2) F. Aharonian, 3.9 day orbital modulation in the TeV gamma-ray flux and spectrum from the X-ray binary LS 5039, Link |
| [4] | J. Casares, A possible black hole in the gamma-ray microquasar LS 5039, Link |