Flux and significance maps
Introduction
The gammapy.estimators submodule includes low level functions to compute
significance and test statistics images as well as some high level source
detection method prototypes.
Detailed description of the methods can be found in [Stewart2009] and [LiMa1983].
Note that in Gammapy maps are stored as Numpy arrays, which implies that it’s very easy to use scikit-image or photutils or other packages that have advanced image analysis and source detection methods readily available.
Computation of TS images
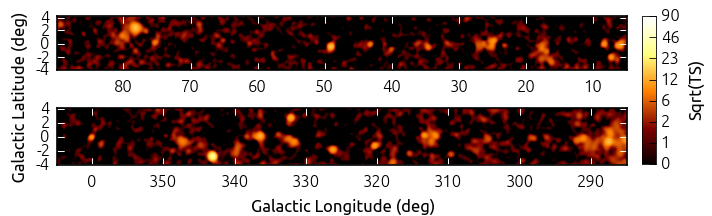
Test statistics image computed using TSMapEstimator for an
example Fermi dataset.
The gammapy.estimators module includes a high performance
TSMapEstimator class to compute test statistics (TS) images
for gamma-ray data. The implementation is based on the method described
in [Stewart2009].
Assuming a certain source morphology, which can be defined by any
astropy.convolution.Kernel2D instance, the amplitude of the morphology model
is fitted at every pixel of the input data using a Poisson maximum likelihood
procedure. As input data a counts, background and exposure images have to be
provided. Based on the best fit flux amplitude, the change in TS, compared to
the null hypothesis is computed using cash statistics.
To optimize the performance of the code, the fitting procedure is simplified by finding roots of the derivative of the fit statistics with respect to the flux amplitude. This approach is described in detail in Appendix A of [Stewart2009].
The following example shows how to compute a TS image for Fermi-LAT 3FHL galactic center data:
from gammapy.estimators import TSMapEstimator
from gammapy.datasets import MapDataset
from gammapy.maps import Map
from gammapy.irf import PSFKernel
from gammapy.modeling.models import BackgroundModel

counts =  Map.read("$GAMMAPY_DATA/fermi-3fhl-gc/fermi-3fhl-gc-counts-cube.fits.gz")
background = Map.read("$GAMMAPY_DATA/fermi-3fhl-gc/fermi-3fhl-gc-background-cube.fits.gz")
exposure = Map.read("$GAMMAPY_DATA/fermi-3fhl-gc/fermi-3fhl-gc-exposure-cube.fits.gz")

dataset = MapDataset(
    counts=counts,
    exposure=exposure,
    models=[BackgroundModel(background, datasets_names=["fermi-3fhl-gc"])],
    name="fermi-3fhl-gc"
)

kernel = PSFKernel.read("$GAMMAPY_DATA/fermi-3fhl-gc/fermi-3fhl-gc-psf.fits.gz")

ts_estimator = TSMapEstimator()
result = ts_estimator.run(dataset)
The function returns an dictionary, that bundles all resulting maps. E.g. here’s how to find the largest TS value:
import numpy as np
np.nanmax(result['ts'].data)
Computation of significance images a la Li & Ma
The method derived by [LiMa1983] is one of the standard methods to determine
detection significances for gamma-ray sources. Using the same prepared Fermi
dataset as above, the corresponding images can be computed using the
ExcessMapEstimator class:
from gammapy.estimators import ExcessMapEstimator
from gammapy.datasets import MapDataset
from gammapy.maps import Map
from gammapy.modeling.models import BackgroundModel

counts =  Map.read("$GAMMAPY_DATA/fermi-3fhl-gc/fermi-3fhl-gc-counts-cube.fits.gz")
background = Map.read("$GAMMAPY_DATA/fermi-3fhl-gc/fermi-3fhl-gc-background-cube.fits.gz")
exposure = Map.read("$GAMMAPY_DATA/fermi-3fhl-gc/fermi-3fhl-gc-exposure-cube.fits.gz")

dataset = MapDataset(
    counts=counts,
    exposure=exposure,
    models=[BackgroundModel(background, datasets_names=["fermi-3fhl-gc"])],
    name="fermi-3fhl-gc"
)
dataset = dataset.to_image()

lima_estimator = LiMaMapEstimator("0.2 deg")
result = lima_estimator.run(dataset)
The function returns a dictionary, that bundles all resulting maps such as significance, flux and correlated counts and excess images.