visualization - Plotting and Visualization
Getting Started
gammapy.visualization provides a few helper functions and classes to create
publication-quality images.
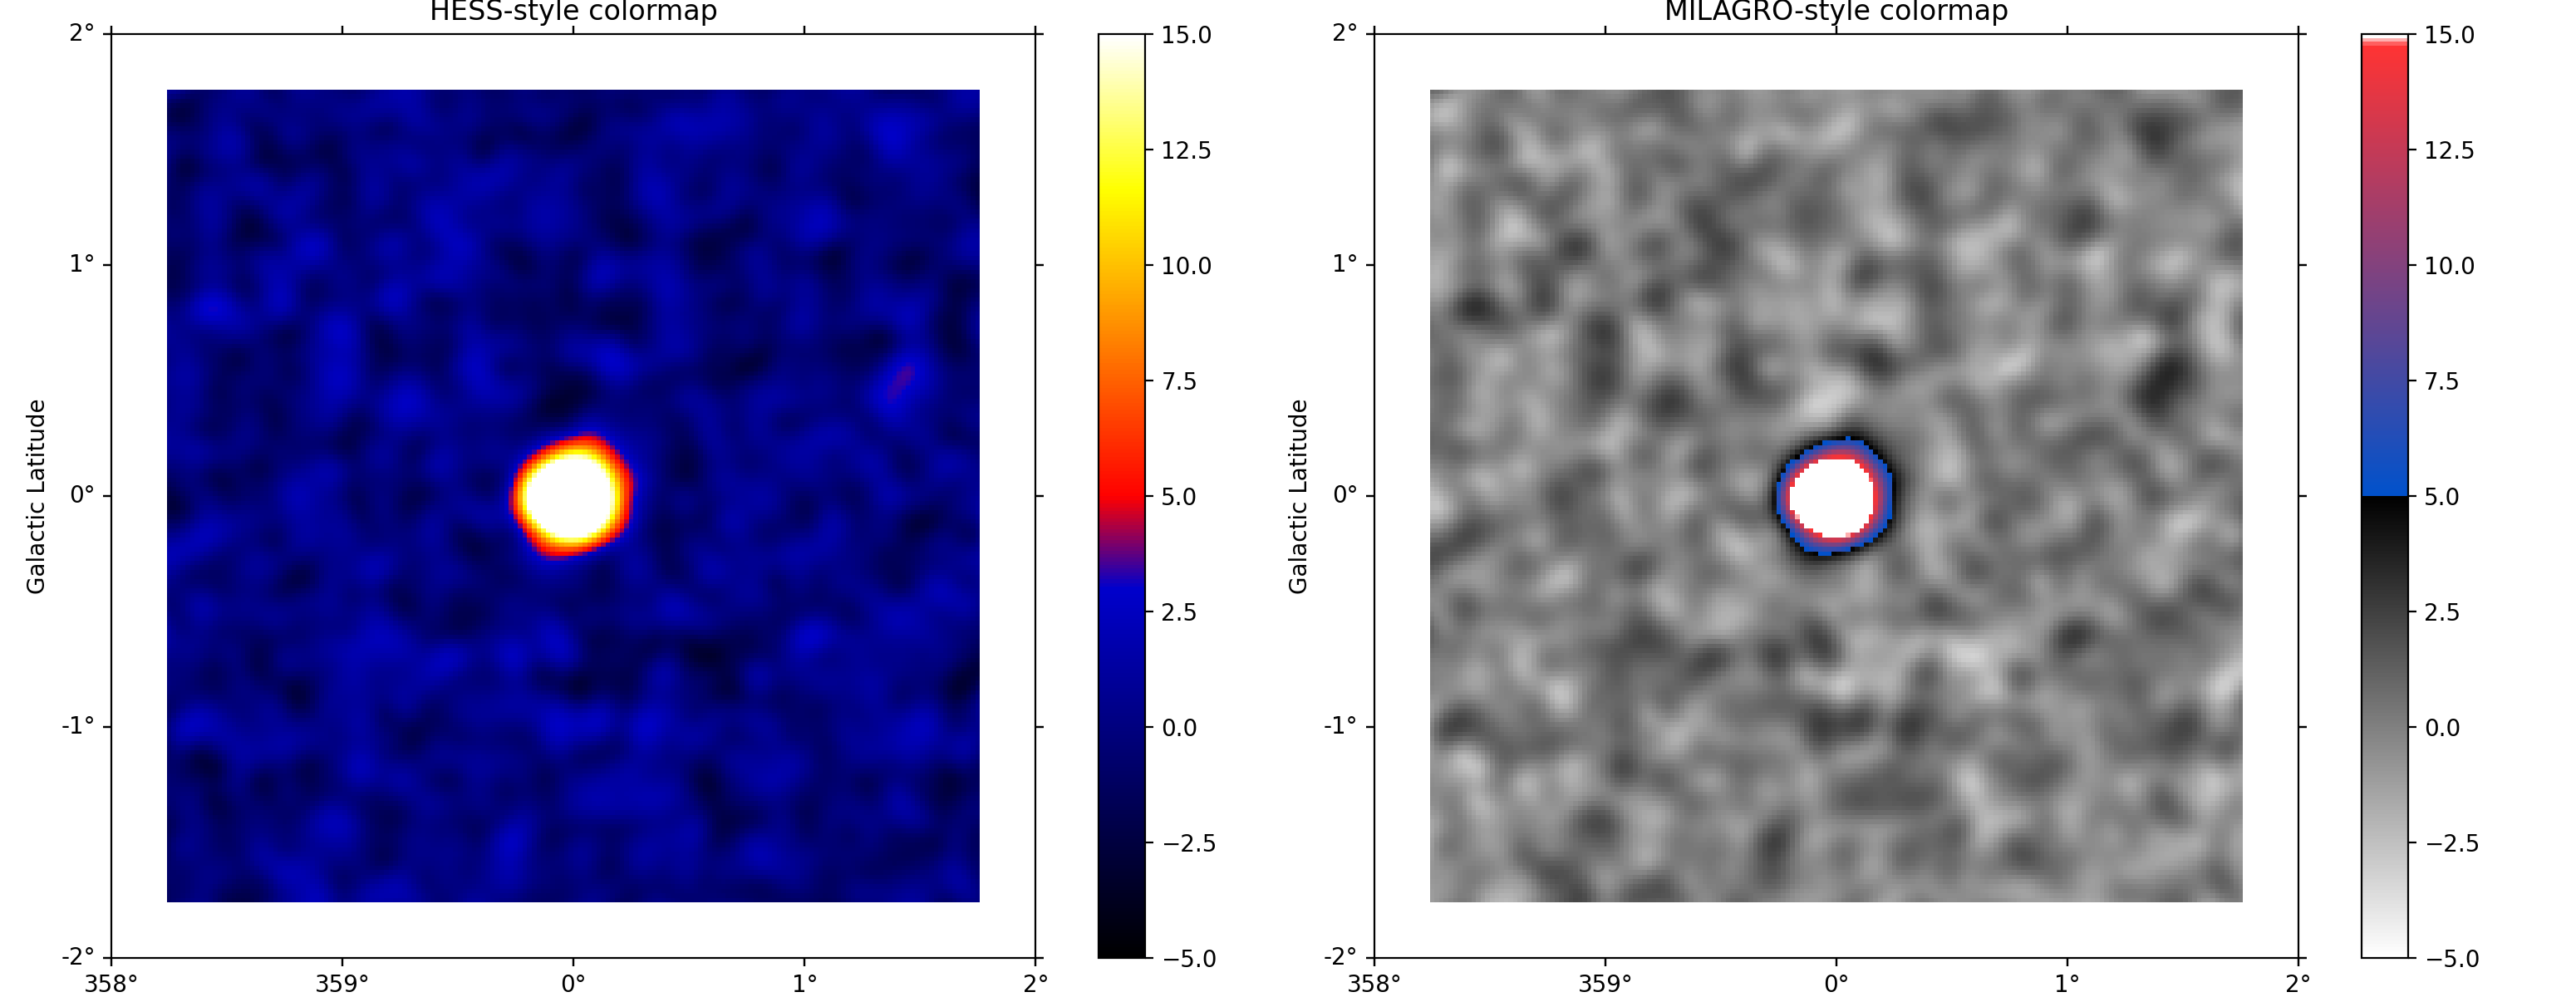
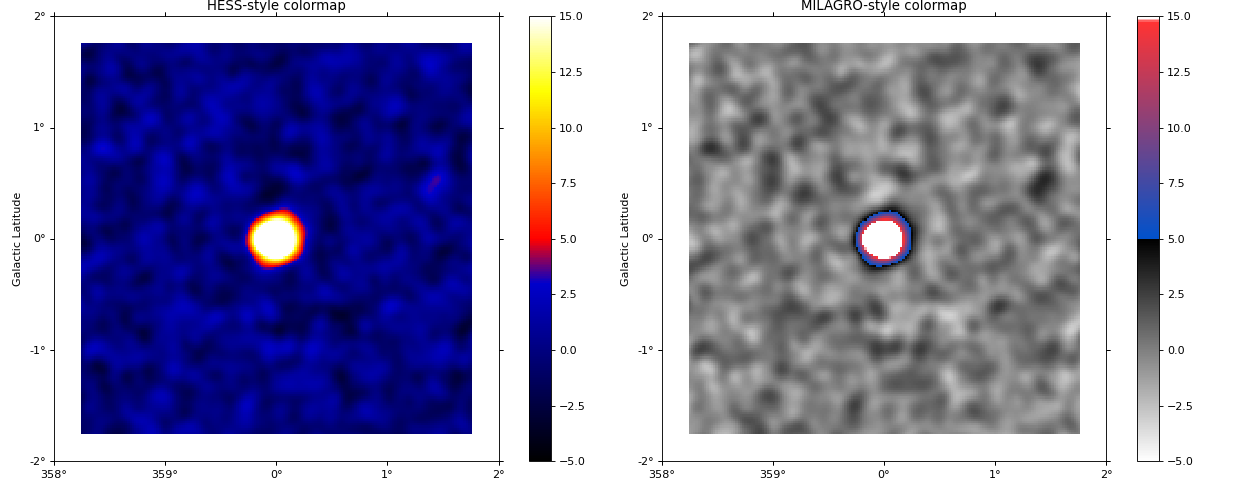
Colormaps
The following example shows how to plot images using colormaps that are commonly
used in gamma-ray astronomy (colormap_hess and colormap_milagro).
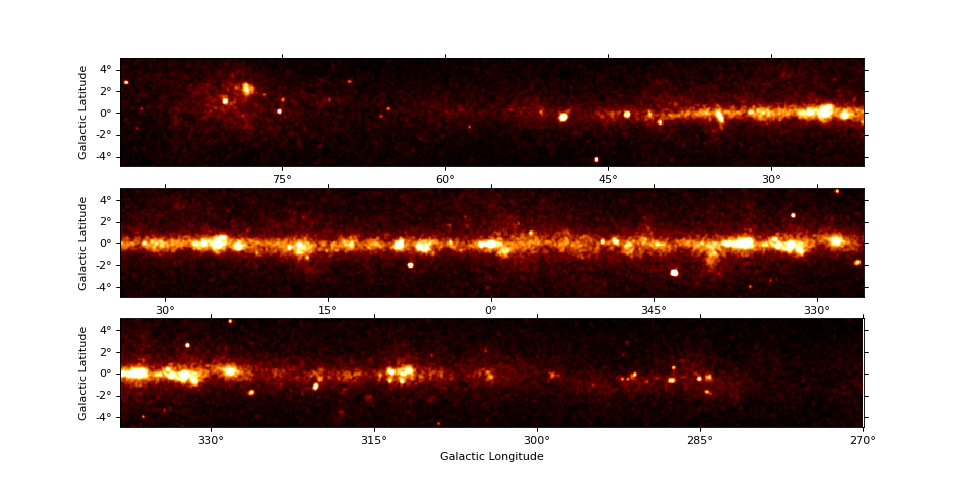
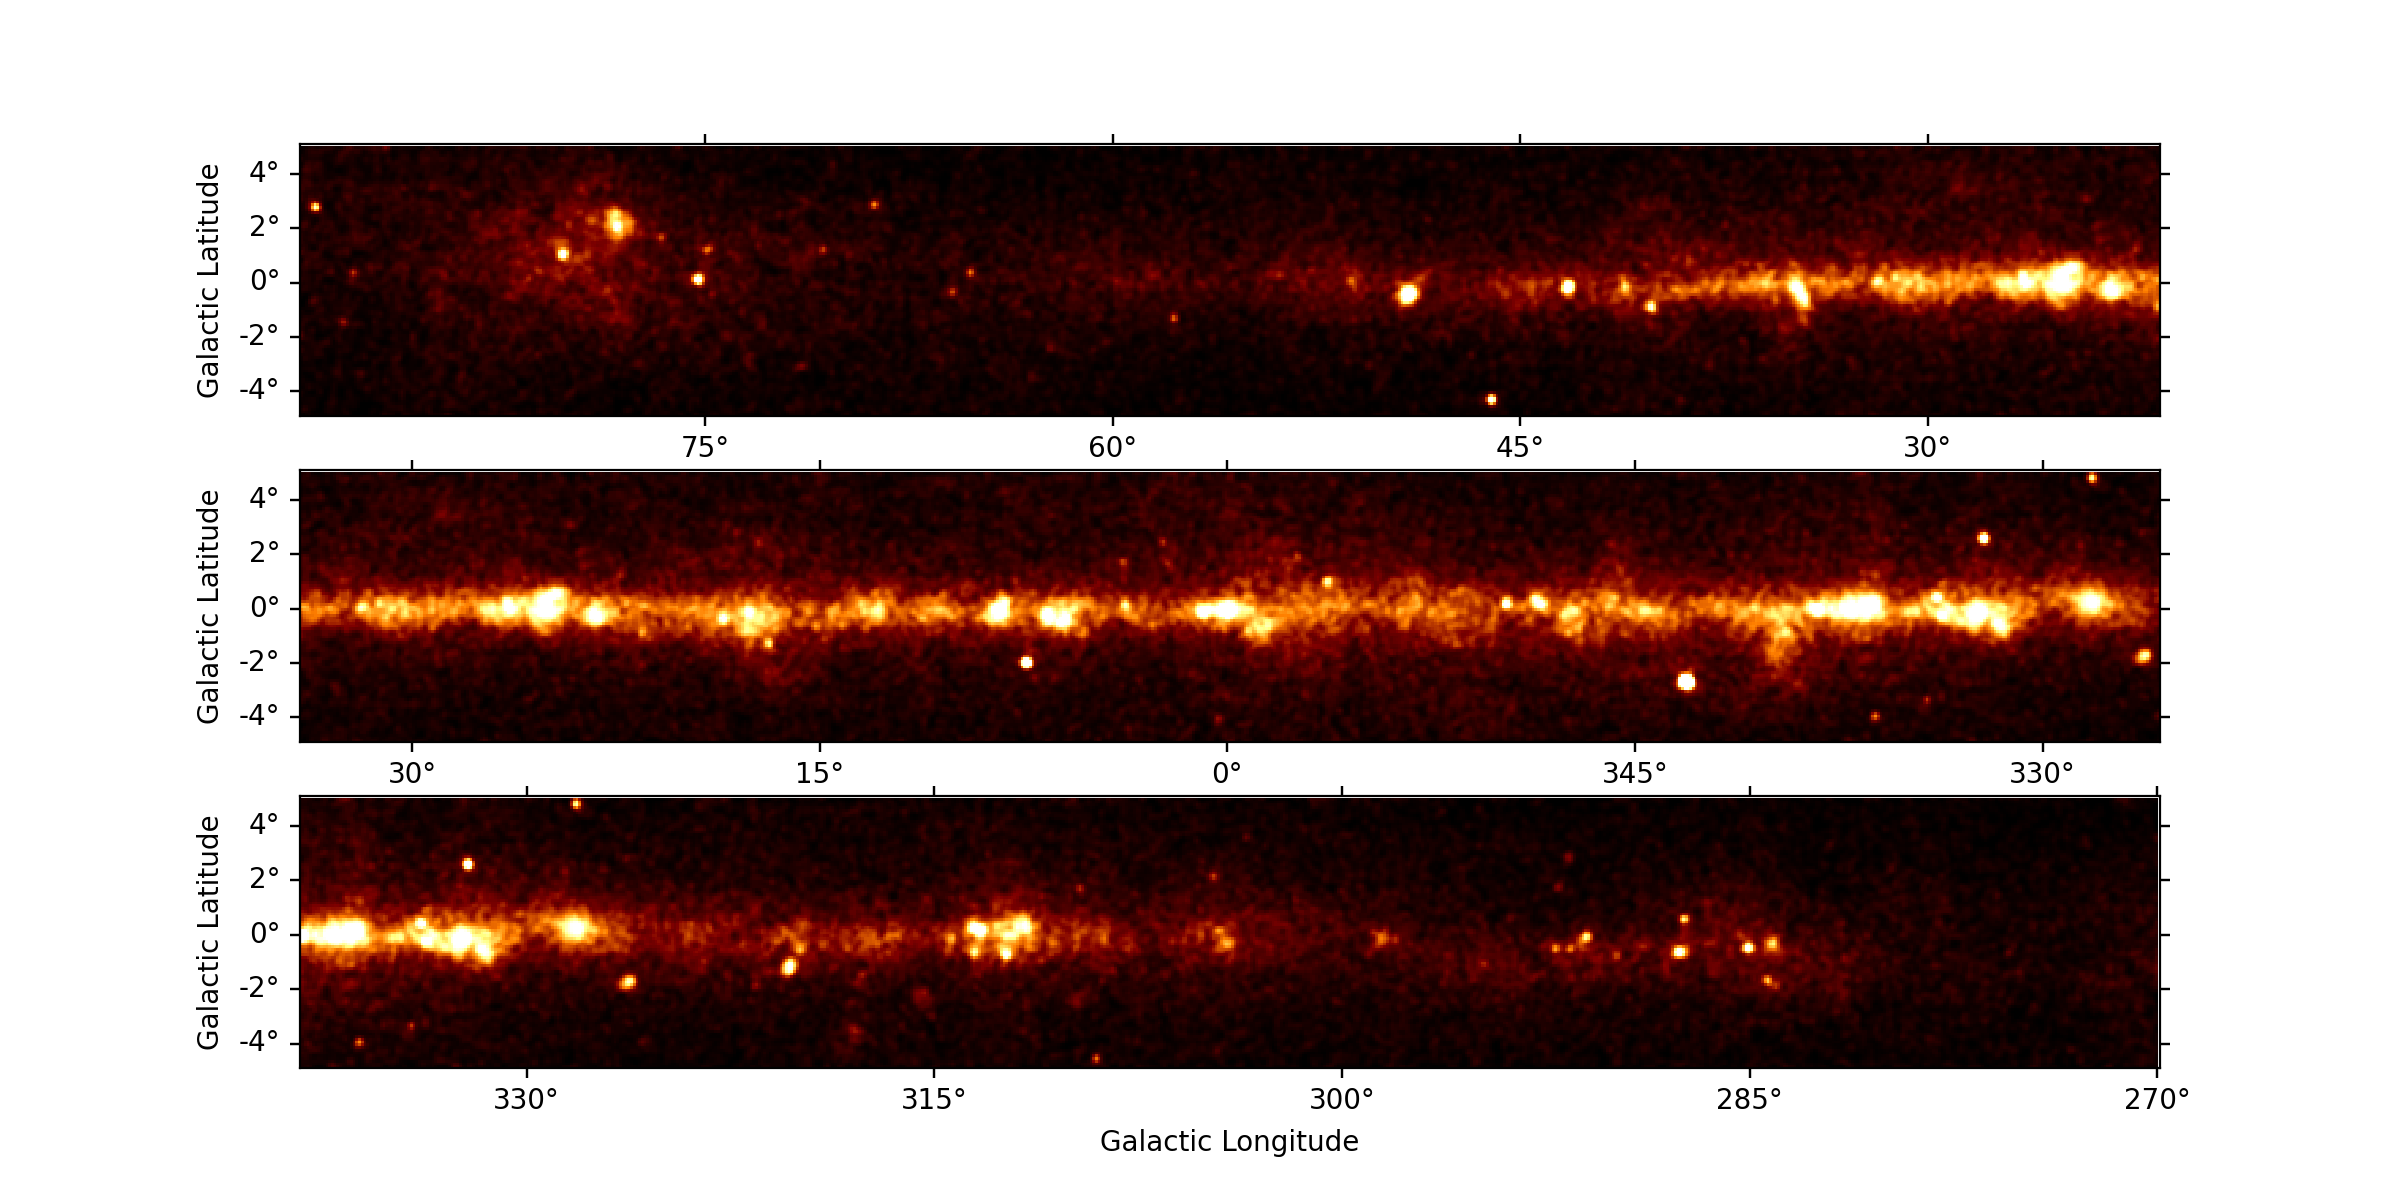
Survey Panel Plots
The MapPanelPlotter allows to split e.g. a galactic plane survey image with
a large aspect ratio into multiple panels. Here is a short example:

Reference/API
gammapy.visualization Package
Functions
|
A function to annotate a heatmap. |
|
Colormap often used in H.E.S.S. |
|
Colormap often used in Milagro collaboration publications. |
|
Plot smooth curve from contour points |
|
Create a heatmap from a numpy array and two lists of labels. |
|
Plot the off regions of spectrum datasets. |
|
Plot the theta2 distribution of ON, OFF counts, excess and signifiance in each theta2bin. |
Classes
|
Map panel plotter class. |