Note
Click here to download the full example code
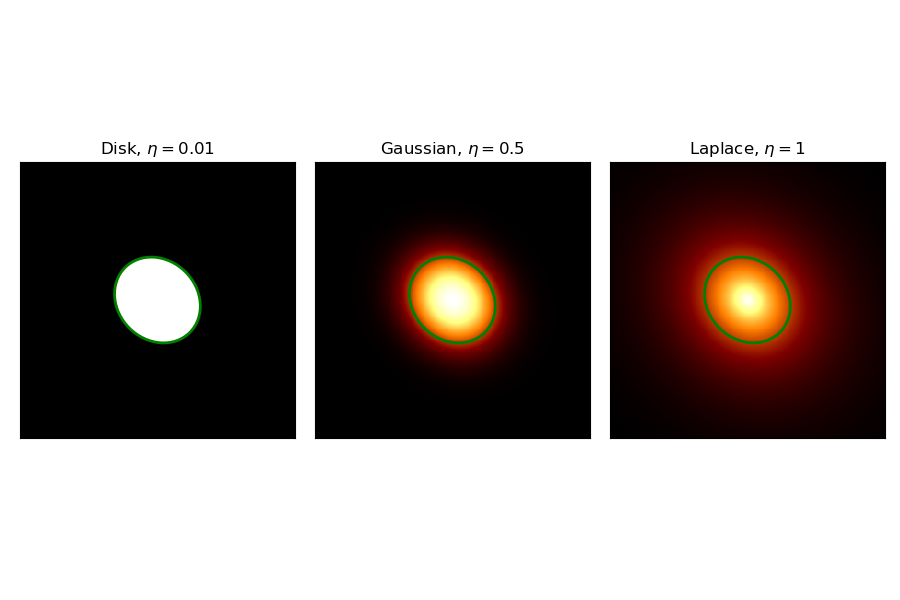
Generalized gaussian spatial model#
This is a spatial model parametrising a generalized Gaussian function.
By default, the Generalized Gaussian is defined as :
the normalization is expressed as:
where \(\Gamma\) is the gamma function. This analytical norm is approximated so it may not integrate to unity in extreme cases if ellipticity tend to one and radius is large or \(\eta\) much larger than one (outside the default range).
The effective radius is given by:
where \(r_M\) (\(r_m\)) is the major (minor) semiaxis, and
\(\Delta \phi\) is the difference between phi, the position angle of the model, and the
position angle of the evaluation point.
If the eccentricity (\(e\)) is null it reduces to \(r_0\).
Example plot#
Here is an example plot of the model for different shape parameter:
from astropy import units as u
import matplotlib.pyplot as plt
from gammapy.maps import Map, WcsGeom
from gammapy.modeling.models import (
    GeneralizedGaussianSpatialModel,
    Models,
    PowerLawSpectralModel,
    SkyModel,
)

lon_0 = 20
lat_0 = 0
reval = 3
dr = 0.02
geom = WcsGeom.create(
    skydir=(lon_0, lat_0),
    binsz=dr,
    width=(2 * reval, 2 * reval),
    frame="galactic",
)

tags = [r"Disk, $\eta=0.01$", r"Gaussian, $\eta=0.5$", r"Laplace, $\eta=1$"]
eta_range = [0.01, 0.5, 1]
r_0 = 1
e = 0.5
phi = 45 * u.deg
fig, axes = plt.subplots(1, 3, figsize=(9, 6))
for ax, eta, tag in zip(axes, eta_range, tags):
    model = GeneralizedGaussianSpatialModel(
        lon_0=lon_0 * u.deg,
        lat_0=lat_0 * u.deg,
        eta=eta,
        r_0=r_0 * u.deg,
        e=e,
        phi=phi,
        frame="galactic",
    )
    meval = model.evaluate_geom(geom)
    Map.from_geom(geom=geom, data=meval.value, unit=meval.unit).plot(ax=ax)
    pixreg = model.to_region().to_pixel(geom.wcs)
    pixreg.plot(ax=ax, edgecolor="g", facecolor="none", lw=2)
    ax.set_title(tag)
    ax.set_xticks([])
    ax.set_yticks([])
plt.tight_layout()
YAML representation#
Here is an example YAML file using the model:
pwl = PowerLawSpectralModel()
gengauss = GeneralizedGaussianSpatialModel()

model = SkyModel(spectral_model=pwl, spatial_model=gengauss, name="pwl-gengauss-model")
models = Models([model])

print(models.to_yaml())
Out:
components:
-   name: pwl-gengauss-model
    type: SkyModel
    spectral:
        type: PowerLawSpectralModel
        parameters:
        -   name: index
            value: 2.0
        -   name: amplitude
            value: 1.0e-12
            unit: cm-2 s-1 TeV-1
        -   name: reference
            value: 1.0
            unit: TeV
            frozen: true
    spatial:
        type: GeneralizedGaussianSpatialModel
        frame: icrs
        parameters:
        -   name: lon_0
            value: 0.0
            unit: deg
        -   name: lat_0
            value: 0.0
            unit: deg
        -   name: r_0
            value: 1.0
            unit: deg
        -   name: eta
            value: 0.5
        -   name: e
            value: 0.0
            frozen: true
        -   name: phi
            value: 0.0
            unit: deg
            frozen: true