Sphere2D
-
class
gammapy.image.models.Sphere2D(amplitude, x_0, y_0, r_0, normed=True, **constraints)[source]¶ Bases:
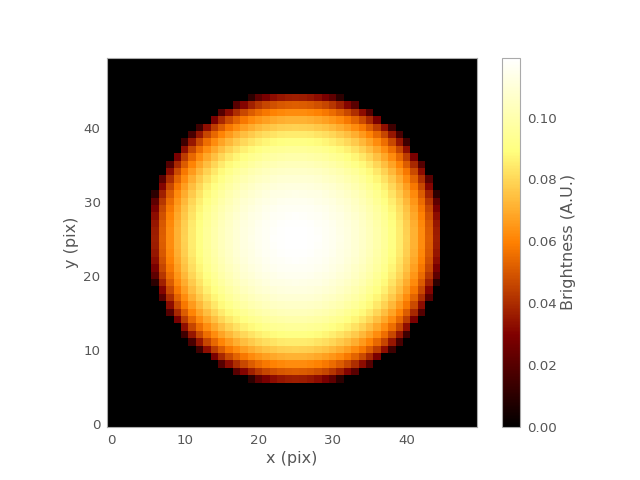
astropy.modeling.Fittable2DModelProjected homogeneous radiating sphere model.
This model can be used for a simple PWN source morphology.
Parameters: amplitude : float
Value of the integral of the sphere function
x_0 : float
x position center of the sphere
y_0 : float
y position center of the sphere
r_0 : float
Radius of the sphere
normed : bool (True)
If set the amplitude parameter corresponds to the integral of the function. If not set the ‘amplitude’ parameter corresponds to the peak value of the function (value at \(r = 0\)).
Notes
Model formula with integral normalization:
\[\begin{split}f(r) = A \frac{3}{4 \pi r_0^3} \cdot \left \{ \begin{array}{ll} \sqrt{r_0^2 - r^2} & : r \leq r_0 \\ 0 & : r > r_0 \end{array} \right.\end{split}\]Model formula with peak normalization:
\[\begin{split}f(r) = A \frac{1}{r_0} \cdot \left \{ \begin{array}{ll} \sqrt{r_0^2 - r^2} & : r \leq r_0 \\ 0 & : r > r_0 \end{array} \right.\end{split}\]Examples
import numpy as np
import matplotlib.pyplot as plt
from gammapy.image.models import Sphere2D

sphere = Sphere2D(amplitude=100, x_0=25, y_0=25, r_0=20)
y, x = np.mgrid[0:50, 0:50]
plt.imshow(sphere(x, y), origin='lower', interpolation='none')
plt.xlabel('x (pix)')
plt.ylabel('y (pix)')
plt.colorbar(label='Brightness (A.U.)')
plt.grid(False)
plt.show()
(Source code, png, hires.png, pdf)

Attributes Summary
amplitudeparam_namesr_0x_0y_0Methods Summary
evaluate(x, y, amplitude, x_0, y_0, r_0)Two dimensional Sphere model function normed to integral evaluate_peak_norm(x, y, amplitude, x_0, ...)Two dimensional Sphere model function normed to peak value Attributes Documentation
-
amplitude
-
param_names= ('amplitude', 'x_0', 'y_0', 'r_0')
-
r_0
-
x_0
-
y_0
Methods Documentation
-