RegionGeom and RegionNDMap#
This page provides examples and documentation specific to the Region classes. These objects are used to bundle the energy distribution - or any other non-spatial axis - of quantities (counts, exposure, …) inside of a given region in the sky while retaining the information of the chosen spatial region. In particular, they are suited for so-called 1D analysis (see Glossary and references).
RegionGeom#
A RegionGeom describes the underlying geometry of a region in the sky with any number of non-spatial axes associated to it.
Is analogous to a map geometry Geom, but instead of a fine spatial grid on a rectangular region,
the spatial dimension is reduced to a single bin with an arbitrary shape, which describes a
region in the sky with that same shape. Besides the spatial region, a RegionGeom can also have any number of non-spatial dimensions,
the most common case being an additional energy axis. The RegionGeom object defines the structure into which the data contained in a RegionNDMap
is distributed.
Region geometries have an associated WCS projection object, which is used to project into the tangential plane for certain operations, such as convolution with a PSF. This projection is defined using the region center, and might introduce deformations for very large regions. This is why the use of regions with size larger than a few degrees is not recommended.
Creating a RegionGeom#
A RegionGeom can be created via a DS9 region string (see http://ds9.si.edu/doc/ref/region.html for a list of options)
or an Astropy Region (https://astropy-regions.readthedocs.io/en/latest/shapes.html). Note that region geometries have an associated
WCS projection object. This requires the region to have a defined center, which is not the case for all the shapes defined
in DS9. Hence only certain shapes are supported for constructing a RegionGeom, such as circles, boxes, ellipses and annuli.
from astropy.coordinates import SkyCoord
from regions import CircleSkyRegion, RectangleSkyRegion, EllipseAnnulusSkyRegion
from gammapy.maps import RegionGeom
import astropy.units as u

# Create a circular region with radius 1 deg centered around
# the Galactic Center
# from DS9 string
geom = RegionGeom.create("galactic;circle(0, 0, 1)")

# using the regions package
center = SkyCoord("0 deg", "0 deg", frame="galactic")
region =  CircleSkyRegion(center=center, radius=1*u.deg)
geom = RegionGeom(region)

# Create a rectangular region with a 45 degree tilt
# from DS9 string
geom = RegionGeom.create("galactic;box(0, 0, 1,2,45)")

# using the regions package
region =  RectangleSkyRegion(center=center, width=1*u.deg, height=2*u.deg, angle=45*u.deg)
geom = RegionGeom(region)

# Equivalent factory method call
geom = RegionGeom.create(region)

# Something a bit more complicated: an elliptical annulus
center_sky = SkyCoord(42, 43, unit='deg', frame='fk5')
region = EllipseAnnulusSkyRegion(center=center_sky,
                                inner_width=3 * u.deg,
                                outer_width=4 * u.deg,
                                inner_height=6 * u.deg,
                                outer_height=7 * u.deg,
                                angle=6 * u.deg)
geom = RegionGeom(region)
Higher dimensional region geometries (cubes and hypercubes) can be constructed in exactly the same way as a WcsGeom
by passing a list of MapAxis objects for non-spatial dimensions with the axes parameter:
from astropy.coordinates import SkyCoord
from regions import CircleSkyRegion
from gammapy.maps import MapAxis, RegionGeom
import astropy.units as u

energy_axis = MapAxis.from_bounds(100., 1e5, 12, interp='log', name='energy', unit='GeV')

# from a DS9 string
geom = RegionGeom.create("galactic;circle(0, 0, 1)", axes=[energy_axis])

#using the regions package
center = SkyCoord("0 deg", "0 deg", frame="galactic")
region =  CircleSkyRegion(center=center, radius=1*u.deg)
geom = RegionGeom(region, axes=[energy_axis])
print(geom)
RegionGeom
<BLANKLINE>
   region     : CircleSkyRegion
   axes       : ['lon', 'lat', 'energy']
   shape      : (1, 1, 12)
   ndim       : 3
   frame      : galactic
   center     : 0.0 deg, 0.0 deg
<BLANKLINE>
The resulting RegionGeom object has ndim = 3, two spatial dimensions with one single bin and the chosen energy axis with 12 bins.
RegionGeom and coordinates#
A RegionGeom defines a single spatial bin with arbitrary shape. The spatial coordinates are then given by the center of the region geometry. If one or more non-spatial axes are present,
they can have any number of bins. There are different methods that can be used to access or modify the coordinates of a RegionGeom.
Bin volume and angular size#
The angular size of the region geometry is given by the method solid_angle(). If a region geometry has any number of non-spatial axes,
then the volume of each bin is given by bin_volume().
If there are no non-spatial axes, both return the same quantity.
from gammapy.maps import MapAxis, RegionGeom

# Create a circular region geometry with an energy axis
energy_axis = MapAxis.from_bounds(100., 1e5, 12, interp='log', name='energy', unit='GeV')
geom = RegionGeom.create("galactic;circle(0, 0, 1)", axes=[energy_axis])

# Get angular size and bin volume
angular_size = geom.solid_angle()
bin_volume = geom.bin_volume()
Coordinates defined by the RegionGeom#
Given a map coordinate or MapCoord object, the method contains() checks if they are contained in the region geometry. One can also retrieve the coordinates of the region geometry with
get_coord() and get_idx(), which return the sky coordinates and indexes respectively. Note that the spatial coordinate will always be a single entry, namely the center, while any non-spatial
axes can have as many bins as desired.
from astropy.coordinates import SkyCoord
from gammapy.maps import RegionGeom

# Create a circular region geometry
geom = RegionGeom.create("galactic;circle(0, 0, 1)")

# Get coordinates and indexes defined by the region geometry
coord = geom.get_coord()
indexes = geom.get_idx()

# Check if a coordinate is contained in the region
geom.contains(center)

# Check if an  array  of coordinates are contained in the region
coordinates = SkyCoord(l = [0, 0.5, 1.5], b = [0.5,2,0], frame='galactic', unit='deg')
geom.contains(coordinates)
Upsampling and downsampling non-spatial axes#
The spatial binning of a RegionGeom is made up of a single bin, that cannot be modified as it defines the region. However, if any non-spatial axes are present, they can be modified using the
upsample() and downsample() methods, which take as input a factor by which the indicated axis is to be up- or downsampled.
from astropy.coordinates import SkyCoord
from regions import CircleSkyRegion
from gammapy.maps import MapAxis, RegionGeom
import astropy.units as u

# Create a circular region geometry with an energy axis
energy_axis = MapAxis.from_bounds(100., 1e5, 12, interp='log', name='energy', unit='GeV')
geom = RegionGeom.create("galactic;circle(0, 0, 1)", axes=[energy_axis])

# Upsample the energy axis by a factor 2
geom_24_energy_bins = geom.upsample(2, "energy")
# Downsample the energy axis by a factor 2
geom_6_energy_bins = geom.downsample(2, "energy")
Relation to WCS geometries#
If a RegionGeom has any number of non-spatial axes, the corresponding region
geometry with just the spatial dimensions is given by the method to_image().
If the region geometry only has spatial dimensions, a copy of it is returned.
Conversely, non-spatial axes can be added to an existing RegionGeom by to_cube(),
which takes a list of non-spatial axes with unique names to add to the region
geometry.
Region geometries are made of a single spatial bin, but are constructed on top
of a finer WcsGeom. The method to_wcs_geom() returns the minimal
equivalent geometry that contains the region geometry. It can also be given as an
argument a minimal width for the resulting geometry.
from gammapy.maps import MapAxis, RegionGeom

# Create a circular region geometry
geom = RegionGeom.create("galactic;circle(0, 0, 1)")

# Add an energy axis to the region geometry
energy_axis = MapAxis.from_bounds(100., 1e5, 12, interp='log', name='energy', unit='GeV')
geom_energy = geom.to_cube([energy_axis])

# Get the image region geometry without the energy axis.
# Note that geom_image == geom
geom_image = geom_energy.to_image()

# Get the minimal wcs geometry that contains the region
wcs_geom = geom.to_wcs_geom()
Plotting a RegionGeom#
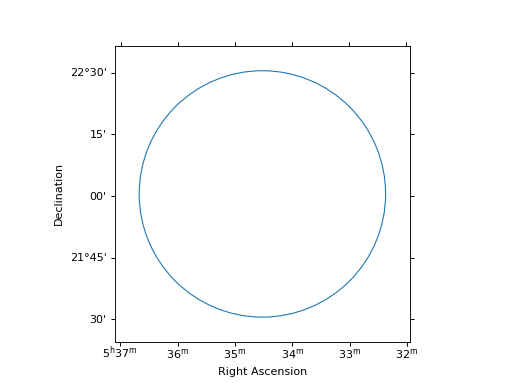
It can be useful to plot the region that defines a RegionGeom, on its own or on top
of an existing Map. This is done via plot_region():
from gammapy.maps import RegionGeom
geom = RegionGeom.create("icrs;circle(83.63, 22.01, 0.5)")
geom.plot_region()

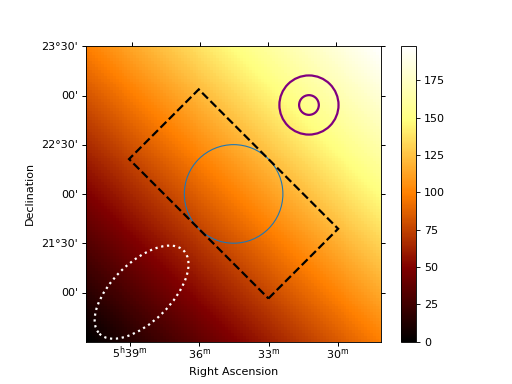
One can also plot the region on top of an existing map, and change the properties of the
different regions by passing keyword arguments forwarded to as_artist.
from gammapy.maps import RegionGeom, Map
import numpy as np

m = Map.create(npix=100,binsz=3/100, skydir=(83.63, 22.01), frame='icrs')
m.data = np.add(*np.indices((100, 100)))

# A circle centered in the Crab position
circle = RegionGeom.create("icrs;circle(83.63, 22.01, 0.5)")

# A box centered in the same position
box = RegionGeom.create("icrs;box(83.63, 22.01, 1,2,45)")

# An ellipse in a different location
ellipse = RegionGeom.create("icrs;ellipse(84.63, 21.01, 0.3,0.6,-45)")

# An annulus in a different location
annulus = RegionGeom.create("icrs;annulus(82.8, 22.91, 0.1,0.3)")

m.plot(add_cbar=True)

# Default plotting settings
circle.plot_region()

# Different line styles, widths and colors
box.plot_region(lw=2, linestyle='--', ec='k')
ellipse.plot_region(lw=2, linestyle=':', ec='white')

# Filling the region with a color
annulus.plot_region(lw=2, ec='purple', fc='purple')

RegionNDMap#
A RegionNDMap owns a RegionGeom instance as well as a data array containing the values associated
to that region in the sky along the non-spatial axis, which is usually an energy axis.
The spatial dimensions of a RegionNDMap are reduced to a single spatial bin with an arbitrary
shape, and any extra dimensions are described by an arbitrary number of non-spatial axes. It is
to a RegionGeom what a Map is to a Geom: it contains the data which is distributed
in the structure defined by the RegionGeom axes.
Creating a RegionNDMap#
A region map can be created either from a DS9 region string, an regions.SkyRegion object or an existing RegionGeom:
from gammapy.maps import RegionGeom, RegionNDMap
from astropy.coordinates import SkyCoord
from regions import CircleSkyRegion
import astropy.units as u

# Create a map of a circular region with radius 0.5 deg centered around
# the Crab Nebula

# from DS9 string
region_map = RegionNDMap.create("icrs;circle(83.63, 22.01, 0.5)")

# using the regions package
center = SkyCoord("83.63 deg", "22.01 deg", frame="icrs")
region =  CircleSkyRegion(center=center, radius=0.5*u.deg)
region_map = RegionNDMap.create(region)

# from an existing RegionGeom, perhaps the one corresponding
# to another, existing RegionNDMap
geom = region_map.geom
region_map_2 = RegionNDMap.from_geom(geom)
Higher dimensional region map objects (cubes and hypercubes)
can be constructed by passing a list of MapAxis objects for non-spatial dimensions with the axes parameter:
from gammapy.maps import MapAxis, RegionNDMap

energy_axis = MapAxis.from_bounds(100., 1e5, 12, interp='log', name='energy', unit='GeV')
region_map = RegionNDMap.create("icrs;circle(83.63, 22.01, 0.5)", axes=[energy_axis])
Filling a RegionNDMap#
All the region maps created above are empty. In order to fill or access the data contained
in a RegionNDMap, the data attribute is used. In case the region map is being
created from an existing RegionGeom, this can be done in the same step:
from gammapy.maps import MapAxis, RegionNDMap
import numpy as np

# Create a RegionNDMap with 12 energy bins
energy_axis = MapAxis.from_bounds(100., 1e5, 12, interp='log', name='energy', unit='GeV')
region_map = RegionNDMap.create("icrs;circle(83.63, 22.01, 0.5)", axes=[energy_axis])

# Fill the region map
# with an entry for each of the 12 energy bins
region_map.data = np.logspace(-2,3,12)

# Create another region map with the same RegionGeom but different data,
# with the same value for each of the 12 energy bins
geom = region_map.geom
region_map_1 = RegionNDMap.from_geom(geom, data=1.)

# Access the data
print(region_map_1.data)
The data contained in a region map is a ndarray with shape defined by the underlying
data_shape. In the case of only spatial dimensions, the shape is just (1,1), one single
spatial bin. If the associated RegionGeom has a non-spatial axis with N bins, the data shape is
then (N, 1, 1), and similarly for additional non-spatial axes.
Visualing a RegionNDMap#
Visualizing a RegionNDMap can be interpreted in two different ways. One is to plot a sky map that contains the region,
indicating the area of the sky encompassed by the spatial component of the region map. This is done via plot_region().
Another option is to plot the contents of the region map, which would be either a single value for the case of only spatial axes,
or a function of the non-spatial axis bins. This is done by plot() and plot_hist().
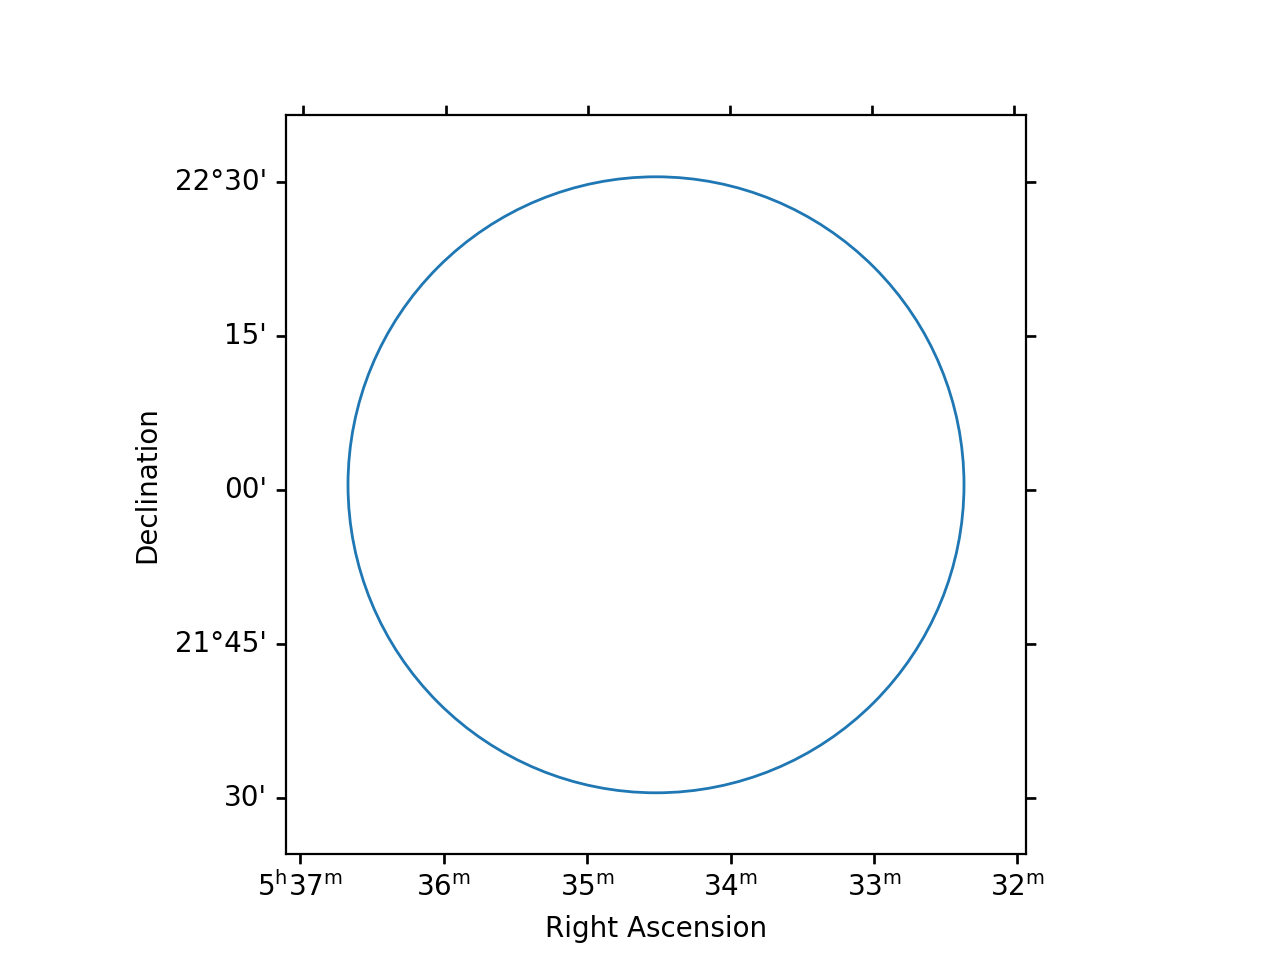
Plotting the underlying region#
This is equivalent to the plot_region() described above, and, in fact, the RegionNDMap method simply calls it on the associated
region geometry, geom. Consequently, the use of this method is already described by the section above.
from gammapy.maps import RegionNDMap
region_map = RegionNDMap.create("icrs;circle(83.63, 22.01, 0.5)")
region_map.plot_region()

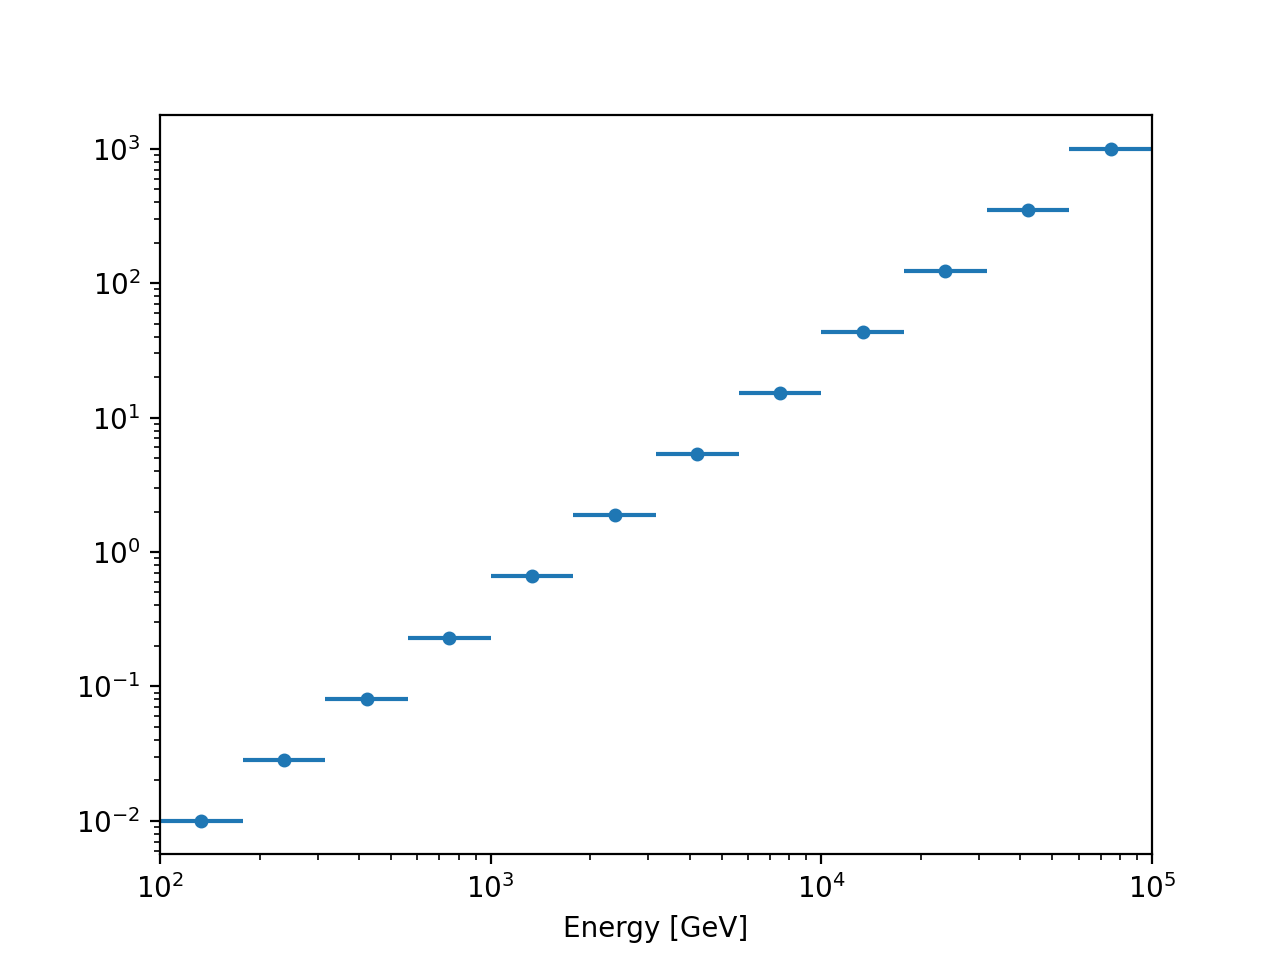
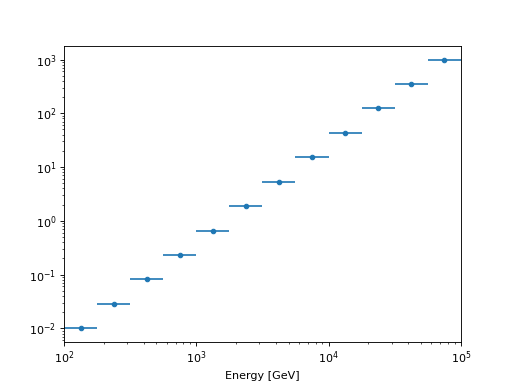
Plotting the map content#
This is only possible if the region map has a non-spatial axis.
from gammapy.maps import MapAxis, RegionNDMap
import numpy as np

# Create a RegionNDMap with 12 energy bins
energy_axis = MapAxis.from_bounds(100., 1e5, 12, interp='log', name='energy', unit='GeV')
region_map = RegionNDMap.create("icrs;circle(83.63, 22.01, 0.5)", axes=[energy_axis])

# Fill the data along the energy axis and plot
region_map.data = np.logspace(-2,3,12)
region_map.plot()
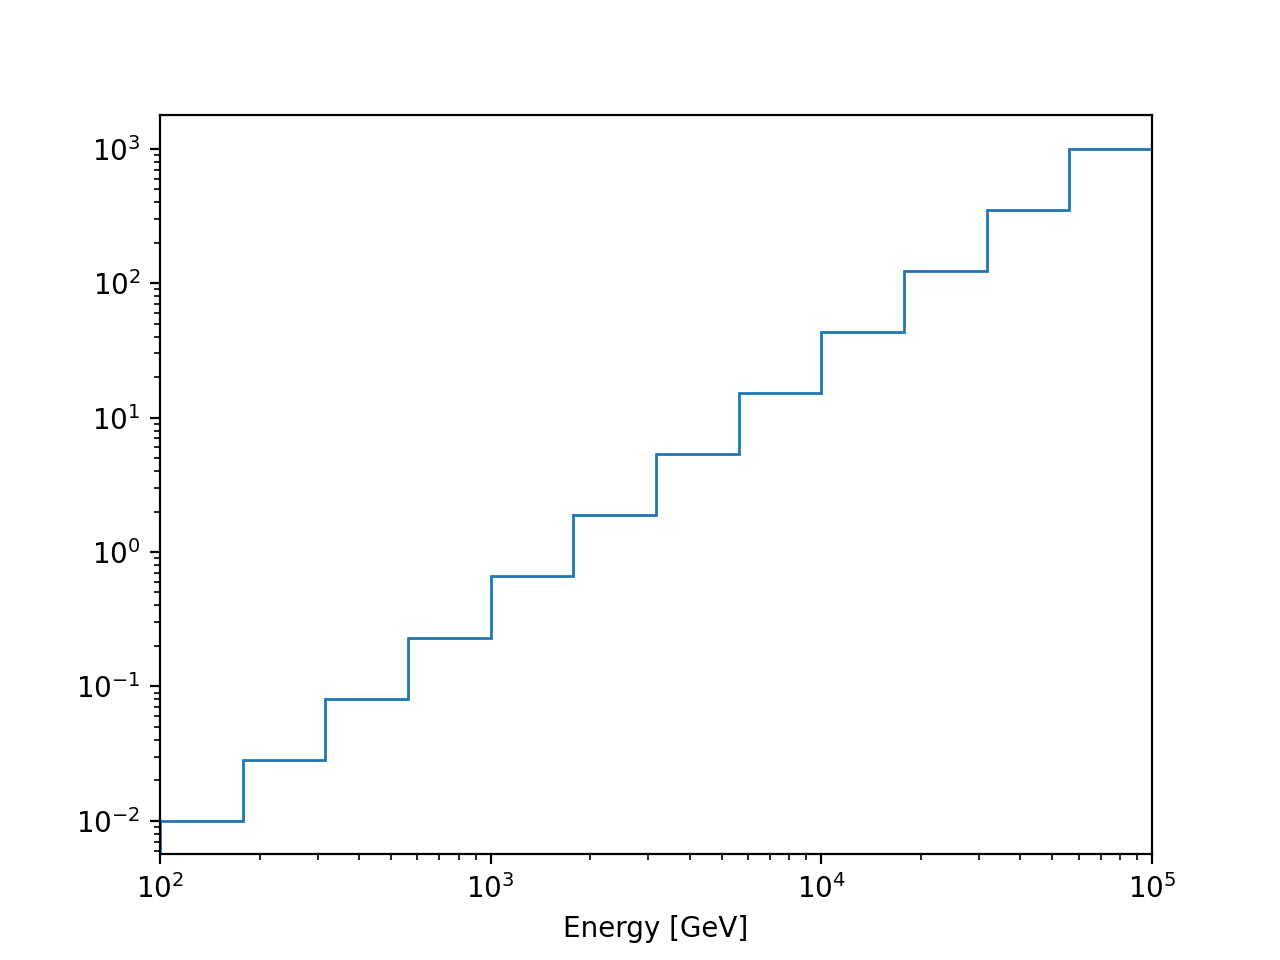
Similarly, the map contents can also be plotted as a histogram:
from gammapy.maps import MapAxis, RegionNDMap
import numpy as np

# Create a RegionNDMap with 12 energy bins
energy_axis = MapAxis.from_bounds(100., 1e5, 12, interp='log', name='energy', unit='GeV')
region_map = RegionNDMap.create("icrs;circle(83.63, 22.01, 0.5)", axes=[energy_axis])

# Fill the data along the energy axis and plot
region_map.data = np.logspace(-2,3,12)
region_map.plot_hist()
Writing and reading a RegionNDMap to/from a FITS file#
Region maps can be written to and read from a FITS file with the
write() and read() methods. Currently
the following formats are supported:
“gadf”: a generic serialisation format with support for ND axes
“ogip” / “ogip-sherpa”: an ogip-like counts spectrum with reconstructed energy axis
“ogip-arf” / “ogip-sherpa”: an ogip-like effective area with true energy axis
The “sherpa” format is equivalent, except energies are stored in “keV” and “cm2”.
For data with an energy axis, so reconstructed energy, the formats ogip and
ogip-sherpa store the data along with the REGION and EBOUNDS HDU.
from gammapy.maps import RegionNDMap,MapAxis
energy_axis = MapAxis.from_bounds(100., 1e5, 12, interp='log', name='energy', unit='GeV')
m = RegionNDMap.create("icrs;circle(83.63, 22.01, 0.5)", axes=[energy_axis])
m.write("file.fits", overwrite=True, format="ogip")
m = RegionNDMap.read("file.fits", format="ogip")
For data with an energy_true axis, so true energy, the formats ogip-arf and ogip-arf-sherpa
store the data in true energy, with the definition of the energy bins. The region information is
however lost.
from gammapy.maps import RegionNDMap,MapAxis
energy_axis = MapAxis.from_bounds(100., 1e5, 12, interp='log', name='energy_true', unit='GeV')
m = RegionNDMap.create("icrs;circle(83.63, 22.01, 0.5)", axes=[energy_axis])
m.write("file.fits", overwrite=True, format="ogip-arf")
m = RegionNDMap.read("file.fits", format="ogip-arf")
Again the “sherpa” format is equivalent, except energies are stored in “keV” and areas in “cm2”.
The “gadf” allows to serialise a region map with arbitrary extra axis as well:
from gammapy.maps import RegionNDMap, MapAxis

energy_axis = MapAxis.from_energy_bounds("1 TeV", "100 TeV", nbin=12)
time_axis = MapAxis.from_bounds(0., 12, nbin=12, interp='lin', unit='h', name='time')

m = RegionNDMap.create("icrs;circle(83.63, 22.01, 0.5)", axes=[energy_axis, time_axis])
m.write("file.fits", overwrite=True, format="gadf")
m = RegionNDMap.read("file.fits", format="gadf")