Note
Go to the end to download the full example code. or to run this example in your browser via Binder
Gaussian temporal model#
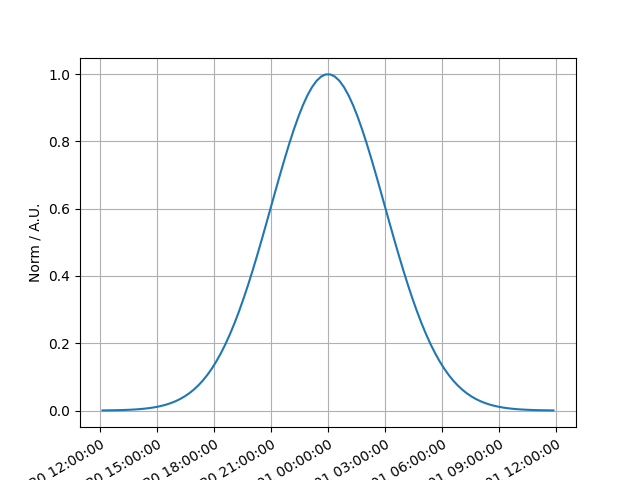
This model parametrises a gaussian time model.
\[F(t) = \exp \left( -0.5 \cdot \frac{ (t - t_{\rm{ref}})^2 } { \sigma^2 } \right)\]
Example plot#
Here is an example plot of the model:
from astropy import units as u
from astropy.time import Time
import matplotlib.pyplot as plt
from gammapy.modeling.models import (
    GaussianTemporalModel,
    Models,
    PowerLawSpectralModel,
    SkyModel,
)

sigma = "3 h"
t_ref = Time("2020-10-01")
time_range = [t_ref - 0.5 * u.d, t_ref + 0.5 * u.d]
gaussian_model = GaussianTemporalModel(t_ref=t_ref.mjd * u.d, sigma=sigma)
gaussian_model.plot(time_range)
plt.grid(which="both")

YAML representation#
Here is an example YAML file using the model:
model = SkyModel(
    spectral_model=PowerLawSpectralModel(),
    temporal_model=gaussian_model,
    name="gaussian_model",
)
models = Models([model])

print(models.to_yaml())
components:
-   name: gaussian_model
    type: SkyModel
    spectral:
        type: PowerLawSpectralModel
        parameters:
        -   name: index
            value: 2.0
        -   name: amplitude
            value: 1.0e-12
            unit: cm-2 s-1 TeV-1
        -   name: reference
            value: 1.0
            unit: TeV
    temporal:
        type: GaussianTemporalModel
        parameters:
        -   name: t_ref
            value: 59123.0
            unit: d
        -   name: sigma
            value: 3.0
            unit: h
        scale: utc
metadata:
    creator: Gammapy 1.3
    date: '2024-11-26T10:08:53.275604'
    origin: null
