Note
Go to the end to download the full example code. or to run this example in your browser via Binder
Gaussian spectral model#
This model parametrises a gaussian spectrum.
It is defined by the following equation:
\[\phi(E) = \frac{N_0}{\sigma \sqrt{2\pi}} \exp{ \frac{- \left( E-\bar{E} \right)^2 }{2 \sigma^2} }\]
Example plot#
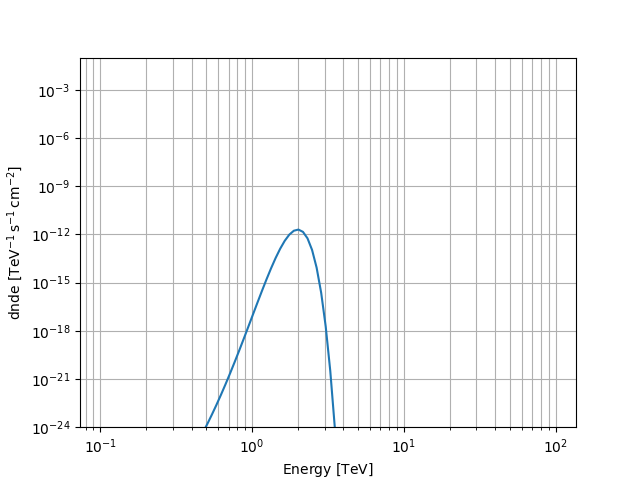
Here is an example plot of the model:
from astropy import units as u
import matplotlib.pyplot as plt
from gammapy.modeling.models import GaussianSpectralModel, Models, SkyModel

energy_bounds = [0.1, 100] * u.TeV
model = GaussianSpectralModel(norm="1e-2 cm-2 s-1", mean=2 * u.TeV, sigma=0.2 * u.TeV)
model.plot(energy_bounds)
plt.grid(which="both")
plt.ylim(1e-24, 1e-1)

(1e-24, 0.1)
YAML representation#
Here is an example YAML file using the model:
components:
-   name: gaussian-model
    type: SkyModel
    spectral:
        type: GaussianSpectralModel
        parameters:
        -   name: amplitude
            value: 1.0e-12
            unit: cm-2 s-1
        -   name: mean
            value: 2.0
            unit: TeV
        -   name: sigma
            value: 0.2
            unit: TeV
metadata:
    creator: Gammapy 1.3
    date: '2024-11-26T10:08:49.382518'
    origin: null
