Reflected regions background
Overview
This technique is used in classical Cherenkov astronomy for the 1D spectral extraction. A region on the sky, the ON region, is chosen to select events around the studied source position. In the absence of a solid template of the residual hadronic background, a classical method to estimate it is the so-called Reflected Region Background. The underlying assumption is that the background is approximately purely radial in the field-of-view. A set of OFF counts is found in the observation, by rotating the ON region selected around the pointing position. To avoid that the reflectd regions contain actual gamma-ray signal from other objects, one has to remove the gamma-ray bright parts of the field-of-view with a exclusion mask. Details on the reflected regions method can be found in [Berge2007]
The extraction of the ON and OFF events from the EventList of a
set of observations is performed by the
ReflectedRegionsBackgroundEstimator. The latter uses the
ReflectedRegionsFinder to create reflected regions for a
given circular on region and exclusion mask.
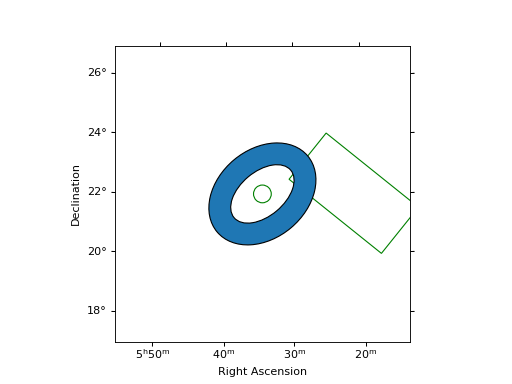
Using regions
The on region is a SkyRegion. It is typically a circle
(CircleSkyRegion) for pointlike source analysis, but can be a more
complex region such as a CircleAnnulusSkyRegion a
EllipseSkyRegion, a RectangleSkyRegion etc.
The following example shows how to create such regions:
"""Example how to compute and plot reflected regions."""
import matplotlib.pyplot as plt
import astropy.units as u
from astropy.coordinates import SkyCoord
from regions import CircleSkyRegion, RectangleSkyRegion, EllipseAnnulusSkyRegion
from gammapy.maps import WcsNDMap

position = SkyCoord(83.63, 22.01, unit="deg", frame="icrs")

on_circle = CircleSkyRegion(position, 0.3 * u.deg)

on_ellipse_annulus = EllipseAnnulusSkyRegion(
    center=position,
    inner_width=1.5 * u.deg,
    outer_width=2.5 * u.deg,
    inner_height=3 * u.deg,
    outer_height=4 * u.deg,
    angle=130 * u.deg,
)

another_position = SkyCoord(80.3, 22.0, unit="deg")
on_rectangle = RectangleSkyRegion(
    center=another_position, width=2.0 * u.deg, height=4.0 * u.deg, angle=50 * u.deg
)

# Now we plot those regions. We first create an empty map
empty_map = WcsNDMap.create(
    skydir=position, width=10 * u.deg, binsz=0.1 * u.deg, proj="TAN"
)
empty_map.data += 1.0
empty_map.plot(cmap="gray", vmin=0, vmax=1)

# To plot the regions, we convert them to PixelRegion with the map wcs
on_circle.to_pixel(empty_map.geom.wcs).plot()
on_rectangle.to_pixel(empty_map.geom.wcs).plot()
on_ellipse_annulus.to_pixel(empty_map.geom.wcs).plot()

plt.show()

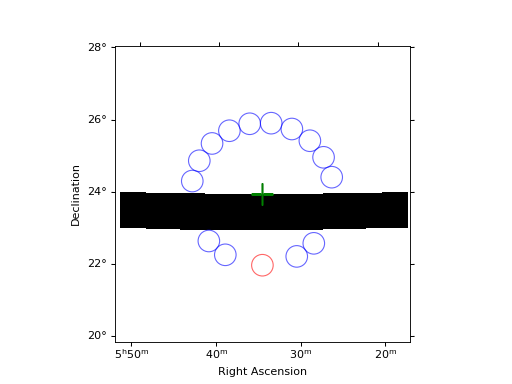
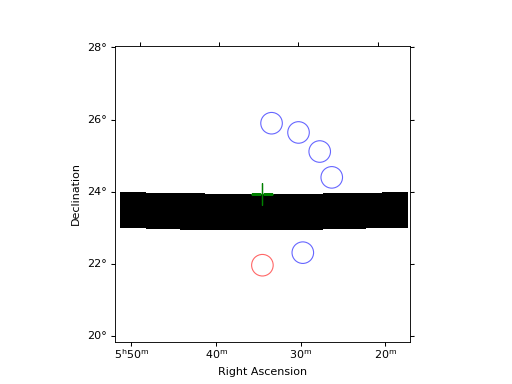
The reflected region finder
The following example illustrates how to create reflected regions for a given
circular on region and exclusion mask using the
ReflectedRegionsFinder. In particular, it shows how to
change the minimal distance between the ON region and the reflected regions.
This is useful to limit contamination by events leaking out the ON region. It
also shows how to change the minimum distance between adjacent regions as well
as the maximum number of reflected regions.
"""Example how to compute and plot reflected regions."""
import matplotlib.pyplot as plt
import numpy as np
from astropy.coordinates import SkyCoord, Angle
from regions import CircleSkyRegion
from gammapy.maps import WcsNDMap
from gammapy.background import ReflectedRegionsFinder
# Exclude a rectangular region
exclusion_mask = WcsNDMap.create(npix=(801, 701), binsz=0.01, skydir=(83.6, 23.0))
coords = exclusion_mask.geom.get_coord().skycoord
mask = (Angle("23d") < coords.dec) & (coords.dec < Angle("24d"))
exclusion_mask.data = np.invert(mask)
pos = SkyCoord(83.633, 22.014, unit="deg")
radius = Angle(0.3, "deg")
on_region = CircleSkyRegion(pos, radius)
center = SkyCoord(83.633, 24, unit="deg")
# One can impose a minimal distance between ON region and first reflected regions
finder = ReflectedRegionsFinder(
region=on_region,
center=center,
exclusion_mask=exclusion_mask,
min_distance_input="0.2 rad",
)
finder.run()
fig1 = plt.figure(1)
finder.plot(fig=fig1)
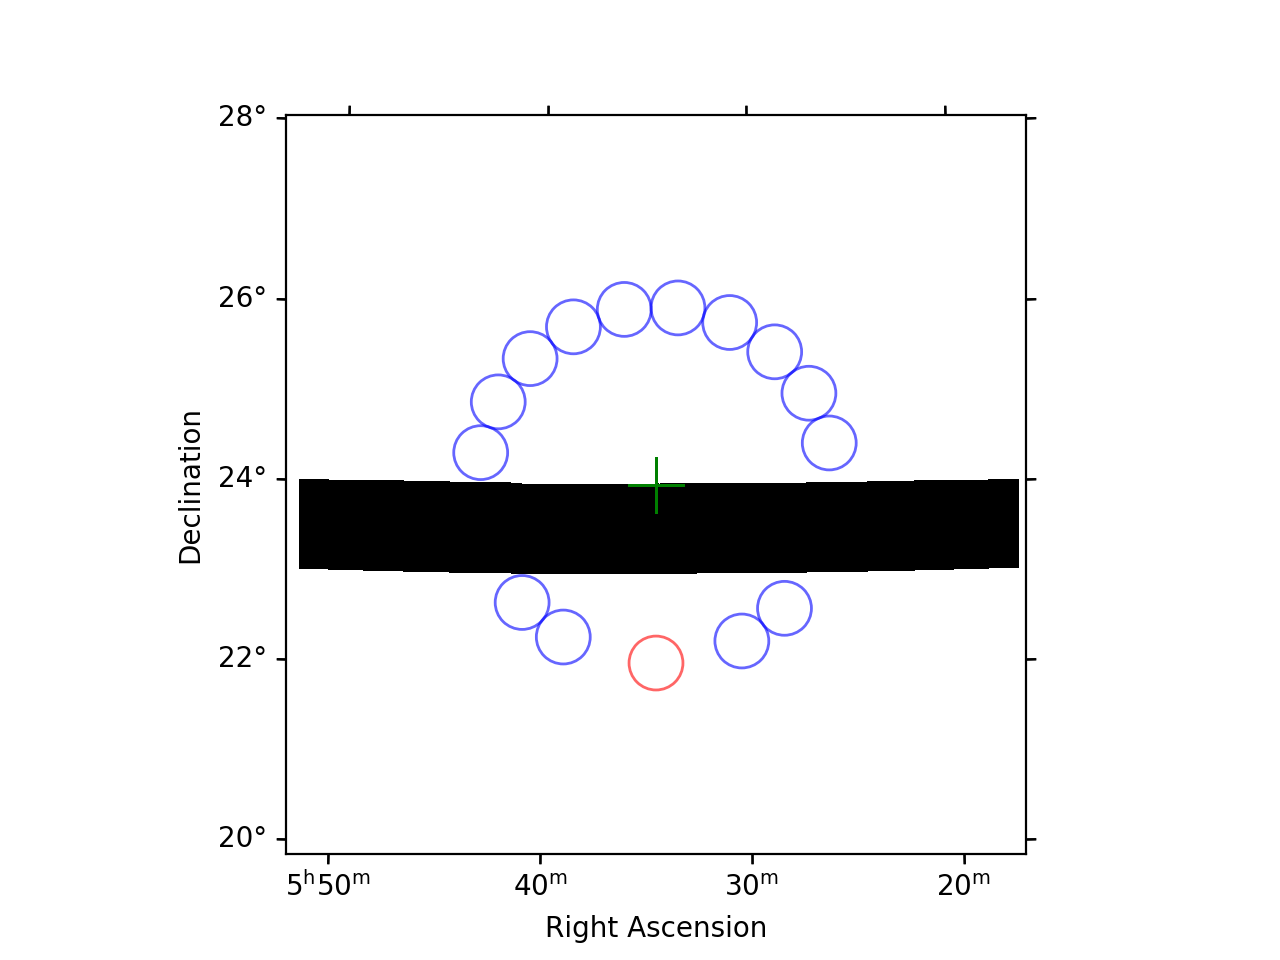
# One can impose a minimal distance between two adjacent regions
finder = ReflectedRegionsFinder(
region=on_region,
center=center,
exclusion_mask=exclusion_mask,
min_distance_input="0.2 rad",
min_distance="0.1 rad",
)
finder.run()
fig2 = plt.figure(2)
finder.plot(fig=fig2)
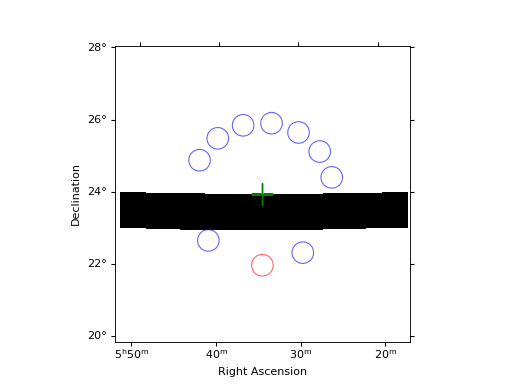
# One can impose a maximal number of regions to be extracted
finder = ReflectedRegionsFinder(
region=on_region,
center=center,
exclusion_mask=exclusion_mask,
min_distance_input="0.2 rad",
max_region_number=5,
min_distance="0.1 rad",
)
finder.run()
fig3 = plt.figure(3)
finder.plot(fig=fig3)
plt.show()


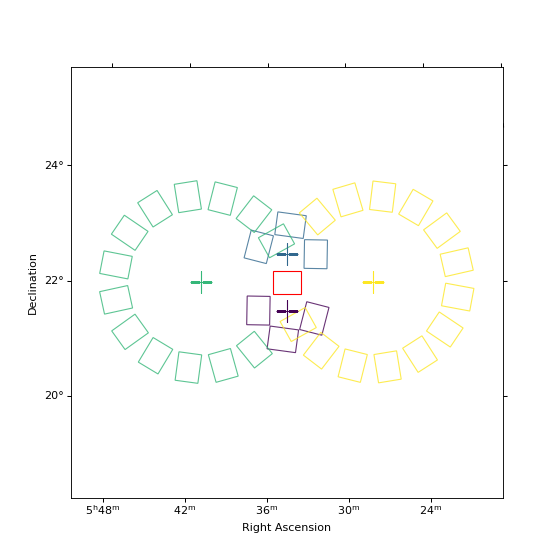
Using the reflected background estimator
In practice, the user does not usually need to directly interact with the
ReflectedRegionsFinder. This actually is done via the
ReflectedRegionsBackgroundEstimator, which extracts the ON
and OFF events for an Observations object. The last example
shows how to run it on a few observations with a rectangular region.
"""Example how to compute and plot reflected regions."""
import matplotlib.pyplot as plt
import astropy.units as u
from astropy.coordinates import SkyCoord
from regions import RectangleSkyRegion
from gammapy.data import DataStore
from gammapy.background import ReflectedRegionsBackgroundEstimator
data_store = DataStore.from_dir("$GAMMAPY_DATA/hess-dl3-dr1/")
mask = data_store.obs_table["TARGET_NAME"] == "Crab"
obs_ids = data_store.obs_table["OBS_ID"][mask].data
observations = data_store.get_observations(obs_ids)
crab_position = SkyCoord(83.63, 22.01, unit="deg", frame="icrs")
# The ON region center is defined in the icrs frame. The angle is defined w.r.t. to its axis.
on_region = RectangleSkyRegion(
center=crab_position, width=0.5 * u.deg, height=0.4 * u.deg, angle=0 * u.deg
)
background_estimator = ReflectedRegionsBackgroundEstimator(
observations=observations, on_region=on_region, min_distance=0.1 * u.rad
)
background_estimator.run()
# Let's inspect the data extracted in the first observation
print(background_estimator.result[0])
background_estimator.plot()
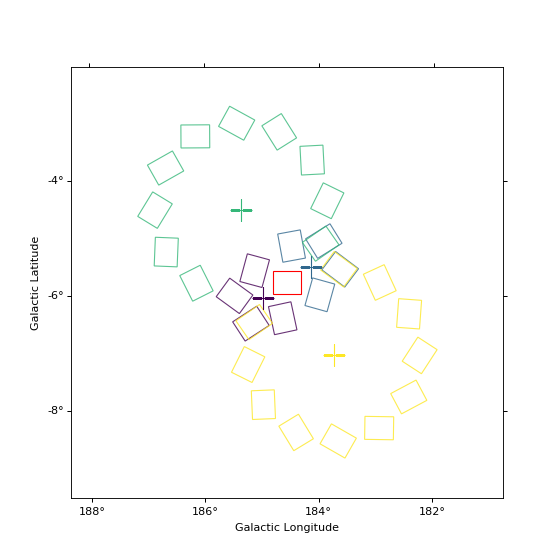
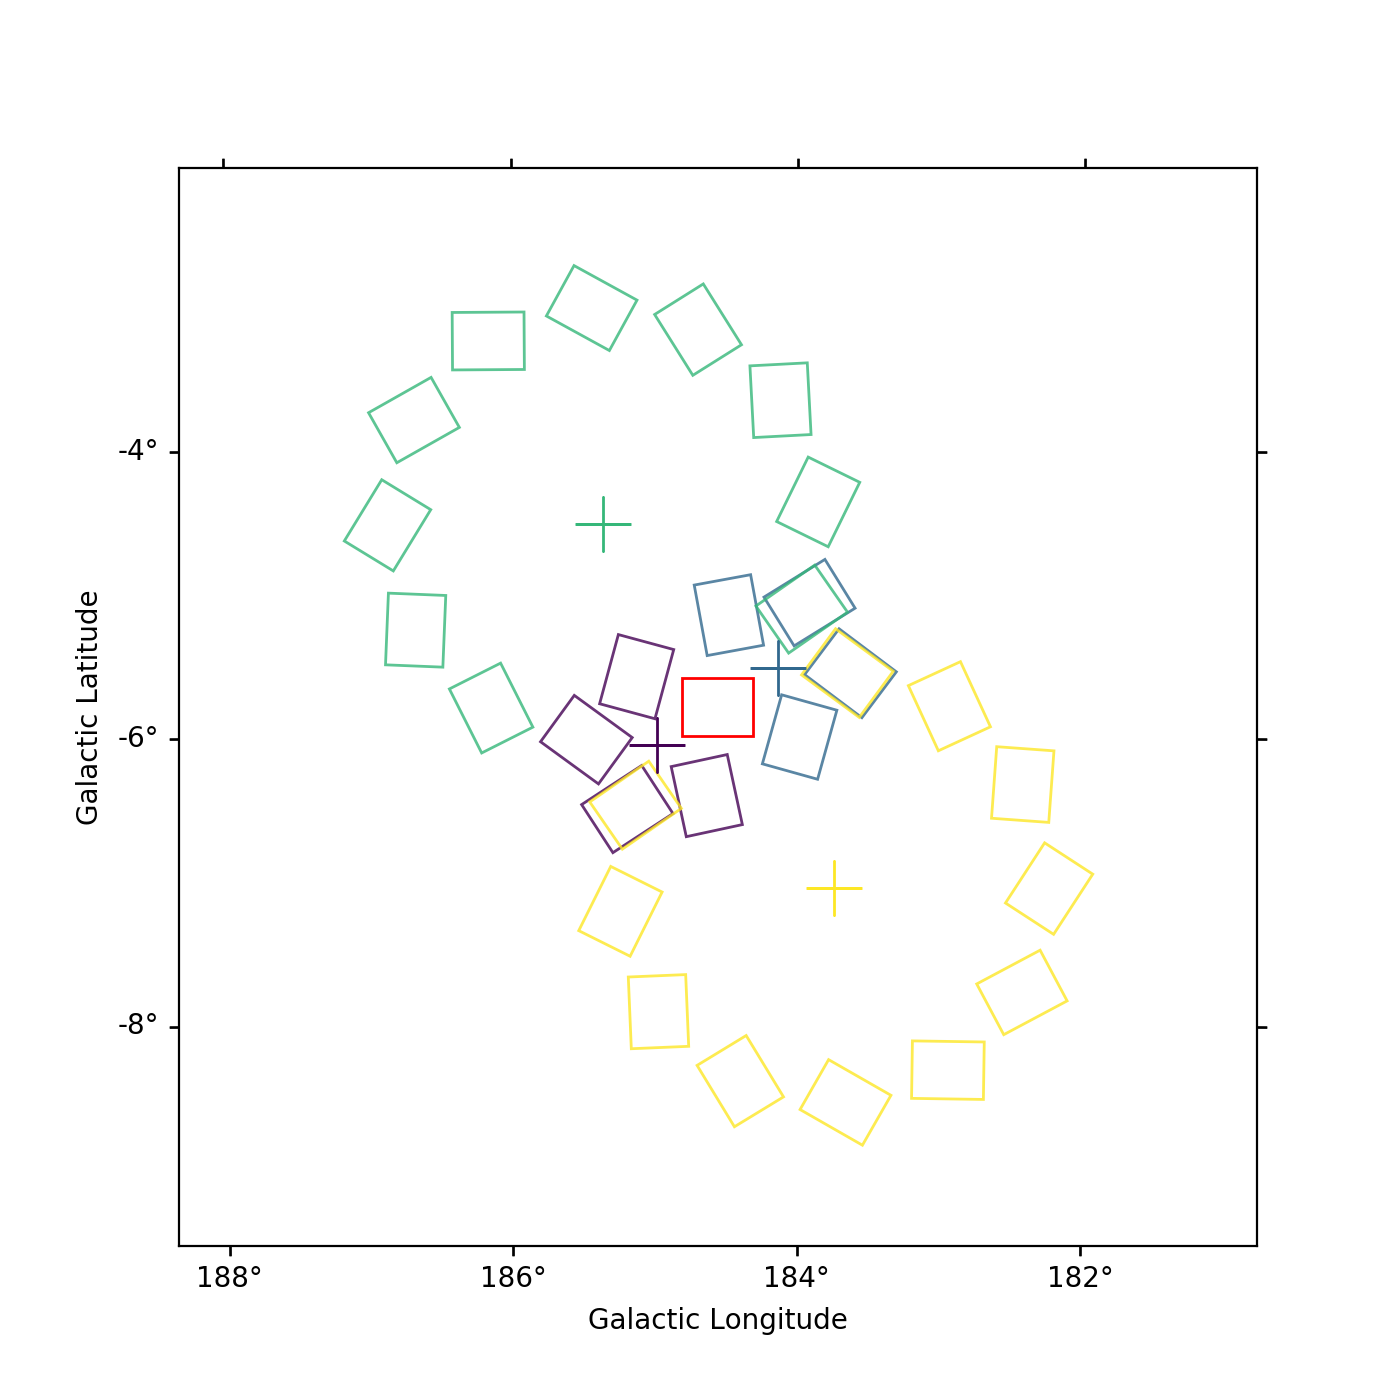
# Now we change the ON region, and use a center defined in the galactic frame
on_region_galactic = RectangleSkyRegion(
center=crab_position.galactic,
width=0.5 * u.deg,
height=0.4 * u.deg,
angle=0 * u.deg,
)
background_estimator = ReflectedRegionsBackgroundEstimator(
observations=observations, on_region=on_region_galactic, min_distance=0.1 * u.rad
)
background_estimator.run()
# The reflected regions are rotated copies of a box aligned with the galactic frame
background_estimator.plot()
plt.show()


The following notebook shows an example using
ReflectedRegionsBackgroundEstimator to perform a spectral
extraction and fitting: