Effective area
as a function of true energy and offset angle (AEFF_2D)
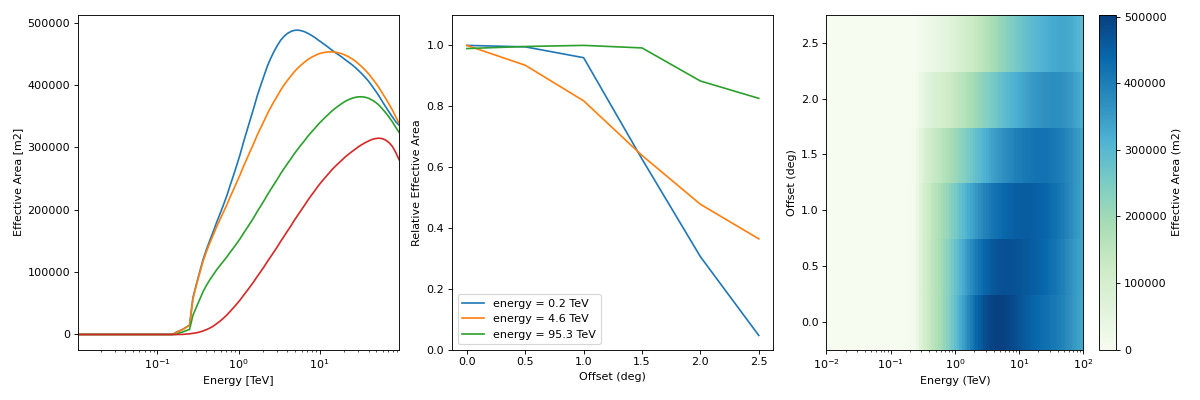
The EffectiveAreaTable2D class represents an effective area as a function of true energy and offset angle from the field of view center
(\(A_{\rm eff}(E_{\rm true}, p_{\rm true})\), following the notation in IRF Theory).
Its format specifications are available in AEFF_2D.
This is the format in which IACT DL3 effective areas are usually provided, as an example
"""Plot an effective area from the HESS DL3 data release 1."""
import matplotlib.pyplot as plt
from gammapy.irf import EffectiveAreaTable2D

filename = "$GAMMAPY_DATA/hess-dl3-dr1/data/hess_dl3_dr1_obs_id_020136.fits.gz"
aeff = EffectiveAreaTable2D.read(filename, hdu="AEFF")
aeff.peek()
plt.show()

as a function of true energy (ARF)
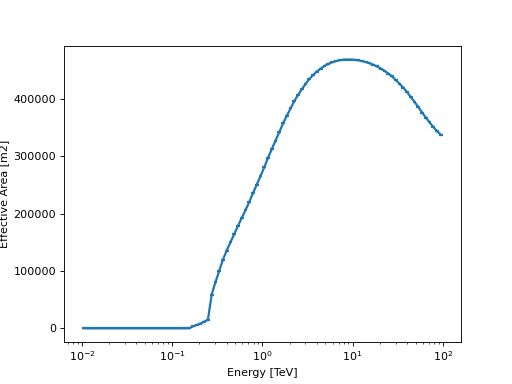
EffectiveAreaTable instead represents an effective area as a function of true energy only
(\(A_{\rm eff}(E_{\rm true})\) following the notation in IRF Theory).
Its format specifications are available in ARF.
Such an area can be obtained, for example:
selecting the value of an
EffectiveAreaTable2Dat a given offset (usingAngle)
"""Plot the effective area at a given offset"""
from astropy.coordinates import Angle
import matplotlib.pyplot as plt
from gammapy.irf import EffectiveAreaTable2D

filename = "$GAMMAPY_DATA/hess-dl3-dr1/data/hess_dl3_dr1_obs_id_020136.fits.gz"
aeff = EffectiveAreaTable2D.read(filename, hdu="AEFF")
# offset at which we want to examine the effective area
offset = Angle("0.5 deg")
aeff_table = aeff.to_effective_area_table(offset=offset)
aeff_table.plot()
plt.show()
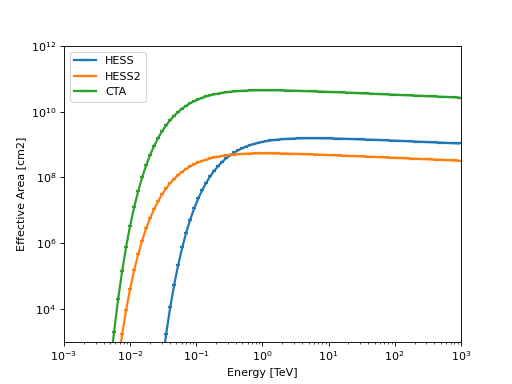
using a pre-defined effective area parameterisation
import numpy as np
import astropy.units as u
import matplotlib.pyplot as plt
from gammapy.irf import EffectiveAreaTable

energy = np.logspace(-3, 3, 100) * u.TeV

for instrument in ["HESS", "HESS2", "CTA"]:
    aeff = EffectiveAreaTable.from_parametrization(energy, instrument)
    ax = aeff.plot(label=instrument)

ax.set_yscale("log")
ax.set_xlim([1e-3, 1e3])
ax.set_ylim([1e3, 1e12])
plt.legend(loc="best")
plt.show()
