Plotting features#
Getting started#
gammapy.visualization provides a few helper functions and classes to create
publication-quality images.
Colormaps#
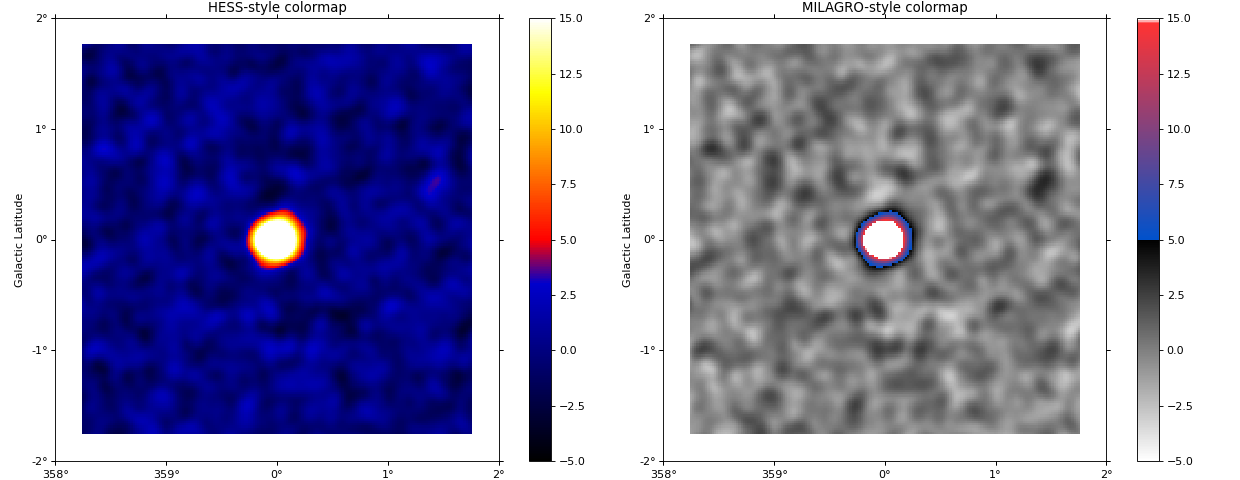
The following example shows how to plot images using colormaps that are commonly
used in gamma-ray astronomy (colormap_hess and colormap_milagro).

Survey panel plots#
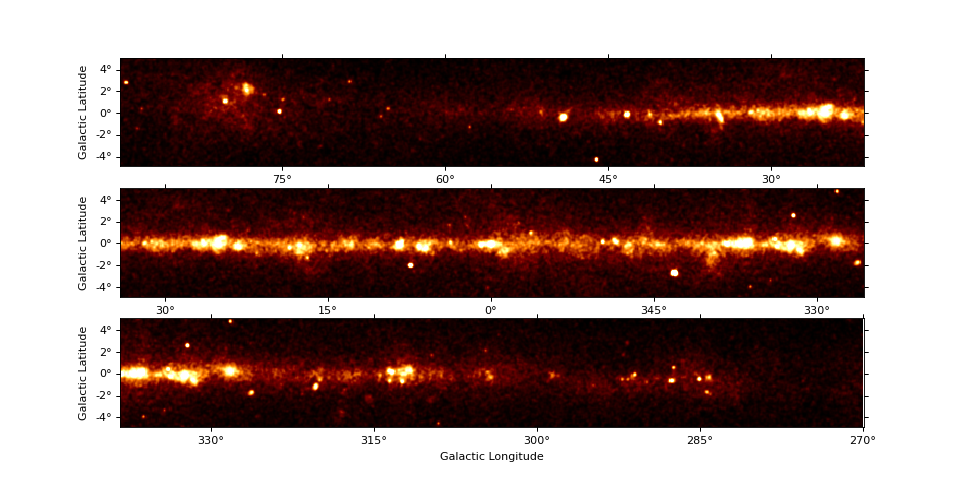
The MapPanelPlotter allows to split e.g. a galactic plane survey image with
a large aspect ratio into multiple panels. Here is a short example:
