Note
Go to the end to download the full example code or to run this example in your browser via Binder
Log parabola spectral model#
This model parametrises a log parabola spectrum.
It is defined by the following equation:
\[\phi(E) = \phi_0 \left( \frac{E}{E_0} \right) ^ {
- \alpha - \beta \log{ \left( \frac{E}{E_0} \right) }
}\]
Note that \(log\) refers to the natural logarithm. This is consistent
with the Fermi Science Tools
and ctools.
The Sherpa package, however, uses \(log_{10}\). If you have
parametrization based on \(log_{10}\) you can use the
from_log10() method.
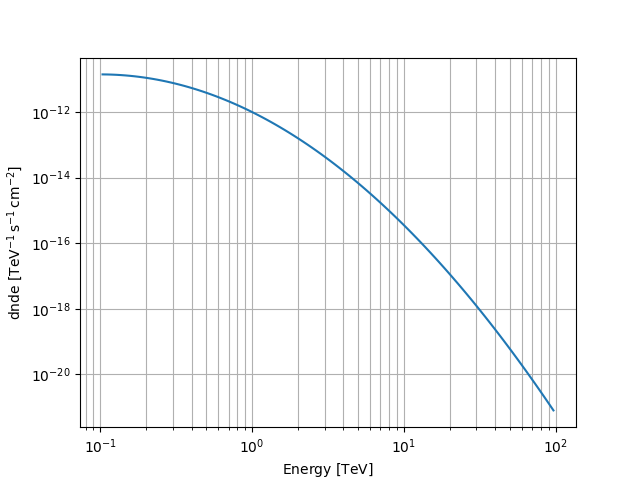
Example plot#
Here is an example plot of the model:
from astropy import units as u
import matplotlib.pyplot as plt
from gammapy.modeling.models import LogParabolaSpectralModel, Models, SkyModel

energy_bounds = [0.1, 100] * u.TeV
model = LogParabolaSpectralModel(
    alpha=2.3,
    amplitude="1e-12 cm-2 s-1 TeV-1",
    reference=1 * u.TeV,
    beta=0.5,
)
model.plot(energy_bounds)
plt.grid(which="both")
YAML representation#
Here is an example YAML file using the model:
components:
-   name: log-parabola-model
    type: SkyModel
    spectral:
        type: LogParabolaSpectralModel
        parameters:
        -   name: amplitude
            value: 1.0e-12
            unit: cm-2 s-1 TeV-1
        -   name: reference
            value: 1.0
            unit: TeV
        -   name: alpha
            value: 2.3
        -   name: beta
            value: 0.5
metadata:
    creator: Gammapy 1.2
    date: '2024-02-29T10:21:54.251206'
    origin: null