colormap_hess
-
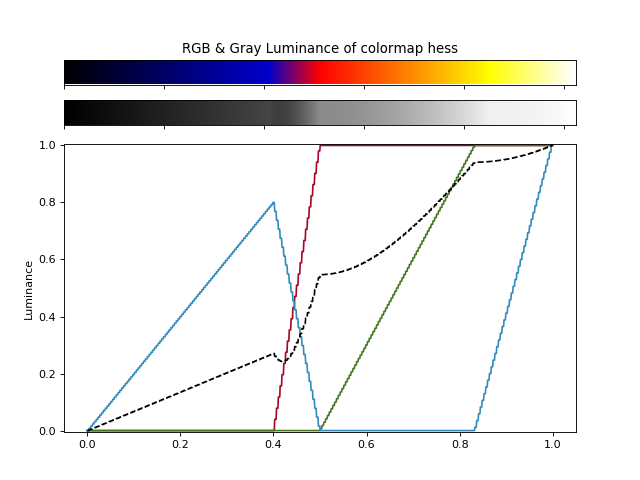
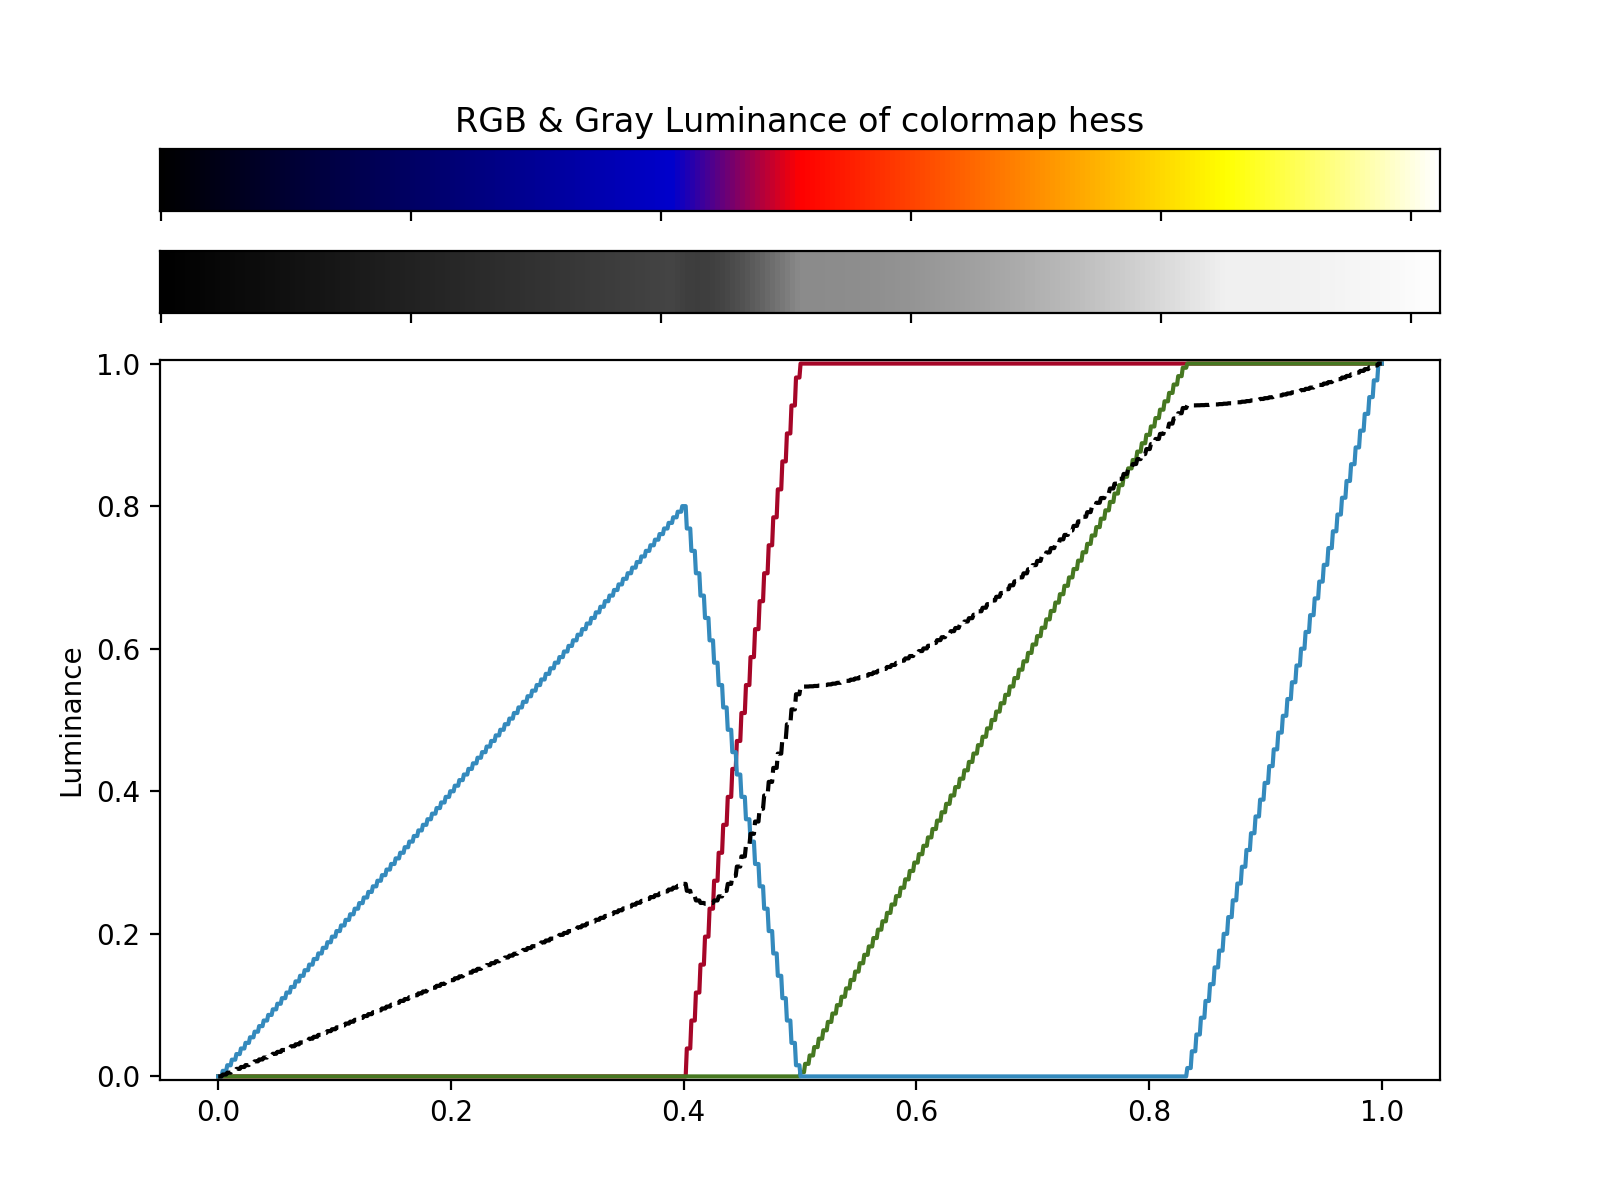
gammapy.image.colormap_hess(transition=0.5, width=0.1)[source]¶ Colormap often used in H.E.S.S. collaboration publications.
This colormap goes black -> blue -> red -> yellow -> white.
A sharp blue -> red -> yellow transition is often used for significance images with a value of red at
transition ~ 5ortransition ~ 7so that the following effect is achieved:- black, blue: non-significant features, not well visible
- red: features at the detection threshold
transition - yellow, white: significant features, very well visible
The transition parameter is defined between 0 and 1. To calculate the value from data units an
ImageNormalizeinstance should be used (see example below).Parameters: - transition : float (default = 0.5)
Value of the transition to red (between 0 and 1).
- width : float (default = 0.5)
Width of the blue-red color transition (between 0 and 1).
Returns: - colormap :
matplotlib.colors.LinearSegmentedColormap Colormap
Examples
>>> from gammapy.image import colormap_hess
>>> from astropy.visualization.mpl_normalize import ImageNormalize
>>> from astropy.visualization import LinearStretch
>>> normalize = ImageNormalize(vmin=-5, vmax=15, stretch=LinearStretch())
>>> transition = normalize(5)
>>> cmap = colormap_hess(transition=transition)
