CountsSpectrum
-
class
gammapy.spectrum.CountsSpectrum(energy_lo, energy_hi, data=None, unit='', region=None)[source]¶ Bases:
objectGeneric counts spectrum.
- Parameters
Examples
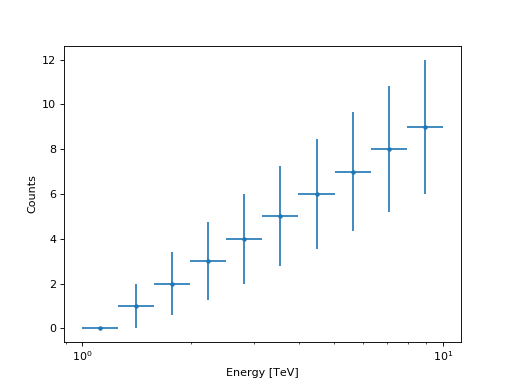
from gammapy.spectrum import CountsSpectrum
import numpy as np
import astropy.units as u

ebounds = np.logspace(0,1,11) * u.TeV
data = np.arange(10)
spec = CountsSpectrum(
    energy_lo=ebounds[:-1],
    energy_hi=ebounds[1:],
    data=data,
)
spec.plot(show_poisson_errors=True)

Attributes Summary
Total number of counts.
Methods Summary
copy(self)A deep copy of self.
downsample(self, factor)Downsample spectrum.
energy_mask(self[, emin, emax])Create a mask for a given energy range.
fill_energy(self, energy)Fill energy values (
Quantity)fill_events(self, events)Fill events (
gammapy.data.EventList).from_hdulist(hdulist[, hdu1, hdu2])Read from HDU list in OGIP format.
peek(self[, figsize])Quick-look summary plots.
plot(self[, ax, energy_unit, …])Plot as data points.
plot_hist(self[, ax, energy_unit, show_energy])Plot as histogram.
plot_region(self[, ax])Plot region
read(filename[, hdu1, hdu2])Read from file.
to_hdulist(self[, use_sherpa])Convert to
HDUList.to_table(self)Convert to
Table.write(self, filename[, use_sherpa])Write to file.
Attributes Documentation
-
quantity
-
total_counts¶ Total number of counts.
Methods Documentation
-
downsample(self, factor)[source]¶ Downsample spectrum.
- Parameters
- factorint
Downsampling factor.
- Returns
- spectrum
CountsSpectrum Downsampled spectrum.
- spectrum
-
energy_mask(self, emin=None, emax=None)[source]¶ Create a mask for a given energy range.
- Parameters
- emin, emax
Quantity Energy range
- emin, emax
-
fill_events(self, events)[source]¶ Fill events (
gammapy.data.EventList).
-
classmethod
from_hdulist(hdulist, hdu1='COUNTS', hdu2='EBOUNDS')[source]¶ Read from HDU list in OGIP format.
-
plot(self, ax=None, energy_unit='TeV', show_poisson_errors=False, show_energy=None, **kwargs)[source]¶ Plot as data points.
kwargs are forwarded to
errorbar- Parameters
- Returns
- ax:
axis Axis instance used for the plot
- ax:
-
plot_hist(self, ax=None, energy_unit='TeV', show_energy=None, **kwargs)[source]¶ Plot as histogram.
kwargs are forwarded to
hist
-
plot_region(self, ax=None, **kwargs)[source]¶ Plot region
- Parameters
- ax
WCSAxes Axes to plot on.
- **kwargsdict
Keyword arguments forwarded to
as_artist
- ax