Note
Click here to download the full example code
Absorption Spectral Model
This model represents EBL absorption models.
They are usually used as part of AbsorbedSpectralModel
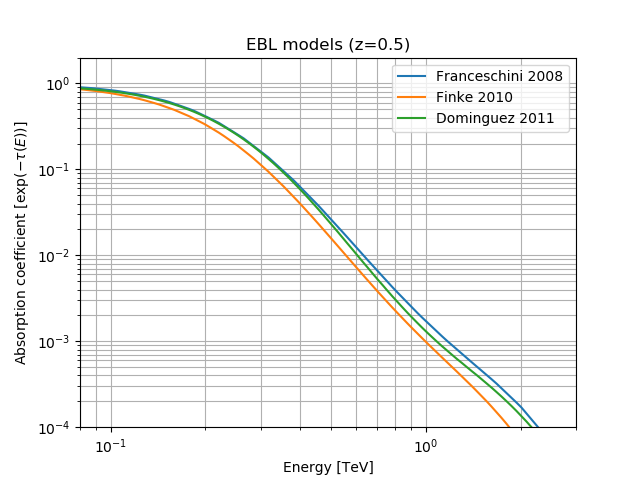
Example plot
Here we illustrate how to create and plot EBL absorption models for a redshift of 0.5:
from astropy import units as u
import matplotlib.pyplot as plt
from gammapy.modeling.models import Absorption

redshift = 0.5
dominguez = Absorption.read_builtin("dominguez").table_model(redshift)
franceschini = Absorption.read_builtin("franceschini").table_model(redshift)
finke = Absorption.read_builtin("finke").table_model(redshift)

plt.figure()
energy_range = [0.08, 3] * u.TeV
opts = dict(energy_range=energy_range, energy_unit="TeV", flux_unit="")
franceschini.plot(label="Franceschini 2008", **opts)
finke.plot(label="Finke 2010", **opts)
dominguez.plot(label="Dominguez 2011", **opts)

plt.ylabel(r"Absorption coefficient [$\exp{(-\tau(E))}$]")
plt.xlim(energy_range.value)
plt.ylim(1e-4, 2)
plt.title(f"EBL models (z={redshift})")
plt.grid(which="both")
plt.legend(loc="best")