SkyEllipse
-
class
gammapy.image.models.SkyEllipse(lon_0, lat_0, semi_major, e, theta, edge='0.01 deg', frame='galactic')[source]¶ Bases:
gammapy.image.models.SkySpatialModelConstant elliptical model.
\[\begin{split}\phi(\text{lon}, \text{lat}) = \begin{cases} N & \text{for } \,\,\,dist(F_1,P)+dist(F_2,P)\leq 2 a \\ 0 & \text{otherwise }\,, \end{cases}\end{split}\]where \(F_1\) and \(F_2\) represent the foci of the ellipse, \(P\) is a generic point of coordinates \((\text{lon}, \text{lat})\), \(a\) is the major semiaxis of the ellipse and N is the model’s normalization, in units of \(\text{sr}^{-1}\).
The model is defined on the celestial sphere, with a normalization defined by:
\[\int_{4\pi}\phi(\text{lon}, \text{lat}) \,d\Omega = 1\,.\]Parameters: - lon_0 :
Longitude \(\text{lon}_0\):
loncoordinate for the center of the ellipse.- lat_0 :
Latitude \(\text{lat}_0\):
latcoordinate for the center of the ellipse.- semi_major :
Angle \(a\): length of the major semiaxis, in angular units.
- e :
float Eccentricity of the ellipse (\(0< e< 1\)).
- theta :
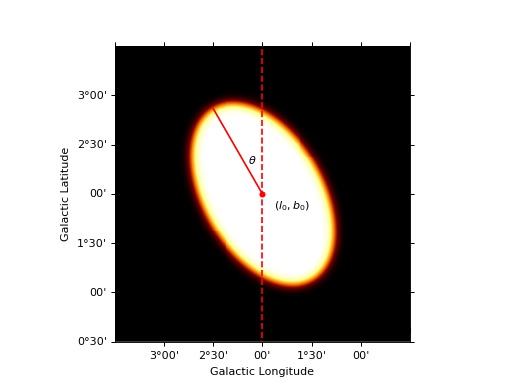
Angle \(\theta\): Rotation angle of the major semiaxis. The rotation angle increases counter-clockwise from the North direction.
- edge :
Angle Width of the edge. The width is defined as the range within the smooth edges of the model drops from 95% to 5% of its amplitude (see illustration for
SkyDisk).- frame : {“galactic”, “icrs”}
Examples
import numpy as np
import matplotlib.pyplot as plt
import astropy.units as u
from gammapy.image.models.core import SkyEllipse
from gammapy.maps import Map, WcsGeom

model = SkyEllipse("2 deg", "2 deg", "1 deg", 0.8, "30 deg", frame= "galactic")

m_geom = WcsGeom.create(binsz=0.01, width=(3, 3), skydir=(2, 2), coordsys="GAL", proj="AIT")
coords = m_geom.get_coord()
lon = coords.lon * u.deg
lat = coords.lat * u.deg
vals = model(lon, lat)
skymap = Map.from_geom(m_geom, data=vals.value)

_, ax, _ = skymap.smooth("0.05 deg").plot()

transform = ax.get_transform('galactic')
ax.scatter(2, 2, transform=transform, s=20, edgecolor='red', facecolor='red')
ax.text(1.7, 1.85, r"$(l_0, b_0)$", transform=transform, ha="center")
ax.plot([2, 2 + np.sin(np.pi / 6)], [2, 2 + np.cos(np.pi / 6)], color="r", transform=transform)
ax.vlines(x=2, color='r', linestyle='--', transform=transform, ymin=0, ymax=5)
ax.text(2.15, 2.3, r"$\theta$", transform=transform);

plt.show()

Attributes Summary
eevaluation_radiusEvaluation radius ( Angle).framelat_0lon_0parametersParameters ( Parameters)positionSpatial model center position semi_majorthetaMethods Summary
__call__(self, lon, lat)Call evaluate method compute_norm(semi_major, e)Compute the normalization factor. copy(self)A deep copy. evaluate(self, lon, lat, lon_0, lat_0, …)Evaluate the model (static function). to_dict(self[, selection])Attributes Documentation
-
e
-
frame
-
lat_0
-
lon_0
-
parameters¶ Parameters (
Parameters)
-
position¶ Spatial model center position
-
semi_major
-
theta
Methods Documentation
-
__call__(self, lon, lat)¶ Call evaluate method
-
copy(self)¶ A deep copy.
-
evaluate(self, lon, lat, lon_0, lat_0, semi_major, e, theta, edge)[source]¶ Evaluate the model (static function).
-
to_dict(self, selection='all')
- lon_0 :