Note
Click here to download the full example code
Log Parabola Spectral Model
This model parametrises a log parabola spectrum.
It is defined by the following equation:
\[\phi(E) = \phi_0 \left( \frac{E}{E_0} \right) ^ {
- \alpha - \beta \log{ \left( \frac{E}{E_0} \right) }
}\]
Note that \(log\) refers to the natural logarithm. This is consistent
with the Fermi Science Tools
and ctools.
The Sherpa package, however, uses \(log_{10}\). If you have
parametrization based on \(log_{10}\) you can use the
from_log10() method.
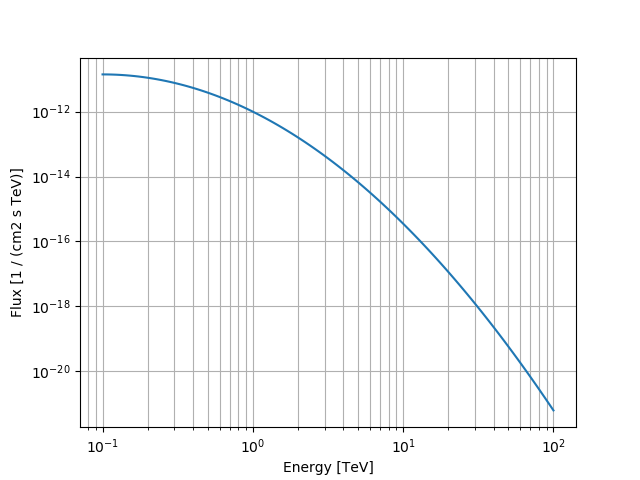
Example plot
Here is an example plot of the model:
from astropy import units as u
import matplotlib.pyplot as plt
from gammapy.modeling.models import LogParabolaSpectralModel, Models, SkyModel

energy_range = [0.1, 100] * u.TeV
model = LogParabolaSpectralModel(
    alpha=2.3, amplitude="1e-12 cm-2 s-1 TeV-1", reference=1 * u.TeV, beta=0.5,
)
model.plot(energy_range)
plt.grid(which="both")
YAML representation
Here is an example YAML file using the model:
Out:
components:
-   name: log-parabola-model
    type: SkyModel
    spectral:
        type: LogParabolaSpectralModel
        parameters:
        - {name: amplitude, value: 1.0e-12, unit: cm-2 s-1 TeV-1, min: .nan, max: .nan,
            frozen: false, error: 0}
        - {name: reference, value: 1.0, unit: TeV, min: .nan, max: .nan, frozen: true,
            error: 0}
        - {name: alpha, value: 2.3, unit: '', min: .nan, max: .nan, frozen: false,
            error: 0}
        - {name: beta, value: 0.5, unit: '', min: .nan, max: .nan, frozen: false,
            error: 0}