This is a fixed-text formatted version of a Jupyter notebook
You can contribute with your own notebooks in this GitHub repository.
Source files: models.ipynb | models.py
Model Gallery
TODO: Write me!
This is an overview of the Gammapy built-in models in gammapy.modeling.models.
Note that there is a separate tutorial modeling.ipynb that explains about gammapy.modeling, the Gammapy modeling and fitting framework. You have to read that to learn how to work with models.
Topics covered here:
How to create spatial, spectral and temporal models.
How to create 3D sky models and other compound models.
How to serialize/read and deserialize/write models.
How to use the model registries to list all available models or serialise models.
[1]:
import numpy as np
import matplotlib.pyplot as plt
from astropy import units as u
from astropy.coordinates import Angle
from gammapy.maps import Map, WcsGeom
import gammapy.modeling.models as gm
Spatial models
[2]:
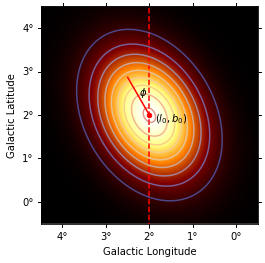
m_geom = WcsGeom.create(
    binsz=0.01, width=(5, 5), skydir=(2, 2), coordsys="GAL", proj="AIT"
)
phi = Angle("30 deg")
model = gm.GaussianSpatialModel(
    lon_0="2 deg",
    lat_0="2 deg",
    sigma="1 deg",
    e=0.7,
    phi=phi,
    frame="galactic",
)

coords = m_geom.get_coord()
vals = model(coords.lon, coords.lat)
skymap = Map.from_geom(m_geom, data=vals.value)

_, ax, _ = skymap.smooth("0.05 deg").plot()

transform = ax.get_transform("galactic")
ax.scatter(2, 2, transform=transform, s=20, edgecolor="red", facecolor="red")
ax.text(1.5, 1.85, r"$(l_0, b_0)$", transform=transform, ha="center")
ax.plot(
    [2, 2 + np.sin(phi)], [2, 2 + np.cos(phi)], color="r", transform=transform
)
ax.vlines(x=2, color="r", linestyle="--", transform=transform, ymin=-5, ymax=5)
ax.text(2.25, 2.45, r"$\phi$", transform=transform)
ax.contour(skymap.data, cmap="coolwarm", levels=10, alpha=0.6)
[2]:
<matplotlib.contour.QuadContourSet at 0x118bc4e80>
[3]:
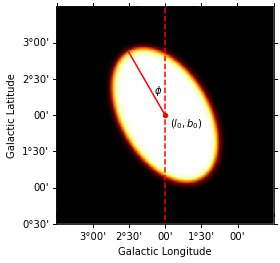
model = gm.DiskSpatialModel(
    lon_0="2 deg",
    lat_0="2 deg",
    r_0="1 deg",
    e=0.8,
    phi="30 deg",
    frame="galactic",
)

m_geom = WcsGeom.create(
    binsz=0.01, width=(3, 3), skydir=(2, 2), coordsys="GAL", proj="AIT"
)
coords = m_geom.get_coord()
vals = model(coords.lon, coords.lat)
skymap = Map.from_geom(m_geom, data=vals.value)

_, ax, _ = skymap.smooth("0.05 deg").plot()

transform = ax.get_transform("galactic")
ax.scatter(2, 2, transform=transform, s=20, edgecolor="red", facecolor="red")
ax.text(1.7, 1.85, r"$(l_0, b_0)$", transform=transform, ha="center")
ax.plot(
    [2, 2 + np.sin(np.pi / 6)],
    [2, 2 + np.cos(np.pi / 6)],
    color="r",
    transform=transform,
)
ax.vlines(x=2, color="r", linestyle="--", transform=transform, ymin=0, ymax=5)
ax.text(2.15, 2.3, r"$\phi$", transform=transform)
[3]:
Text(2.15, 2.3, '$\\phi$')
Spectral models
[4]:
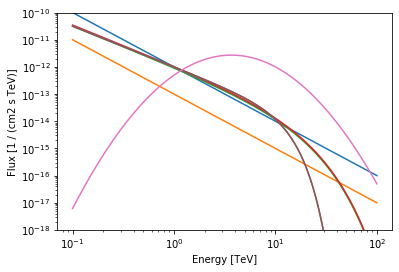
energy_range = [0.1, 100] * u.TeV

pwl = gm.PowerLawSpectralModel()
pwl.plot(energy_range)

pwl2 = gm.PowerLaw2SpectralModel()
pwl2.plot(energy_range)

ecpl = gm.ExpCutoffPowerLawSpectralModel()
ecpl.plot(energy_range)

ecpl_3fgl = gm.ExpCutoffPowerLaw3FGLSpectralModel()
ecpl_3fgl.plot(energy_range)

secpl_3fgl = gm.SuperExpCutoffPowerLaw3FGLSpectralModel()
secpl_3fgl.plot(energy_range)

secpl_4fgl = gm.SuperExpCutoffPowerLaw4FGLSpectralModel()
secpl_4fgl.plot(energy_range)

log_parabola = gm.LogParabolaSpectralModel()
log_parabola.plot(energy_range)

plt.ylim(1e-18, 1e-10)
[4]:
(1e-18, 1e-10)
[5]:
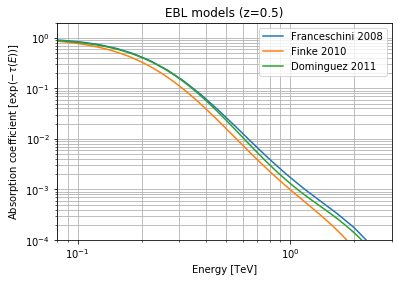
# Create and plot EBL absorption models for a redshift of 0.5

redshift = 0.5
dominguez = gm.Absorption.read_builtin("dominguez").table_model(redshift)
franceschini = gm.Absorption.read_builtin("franceschini").table_model(redshift)
finke = gm.Absorption.read_builtin("finke").table_model(redshift)

plt.figure()
energy_range = [0.08, 3] * u.TeV
opts = dict(energy_range=energy_range, energy_unit="TeV", flux_unit="")
franceschini.plot(label="Franceschini 2008", **opts)
finke.plot(label="Finke 2010", **opts)
dominguez.plot(label="Dominguez 2011", **opts)

plt.ylabel(r"Absorption coefficient [$\exp{(-\tau(E))}$]")
plt.xlim(energy_range.value)
plt.ylim(1e-4, 2)
plt.title(f"EBL models (z={redshift})")
plt.grid(which="both")
plt.legend(loc="best")
[5]:
<matplotlib.legend.Legend at 0x1172867f0>
[6]:
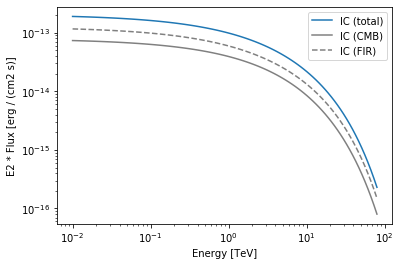
# Create and plot a spectral model that convolves an `ExpCutoffPowerLawSpectralModel` electron distribution
# with an `InverseCompton` radiative model, in the presence of multiple seed photon fields.

import naima

particle_distribution = naima.models.ExponentialCutoffPowerLaw(
    1e30 / u.eV, 10 * u.TeV, 3.0, 30 * u.TeV
)
radiative_model = naima.radiative.InverseCompton(
    particle_distribution,
    seed_photon_fields=["CMB", ["FIR", 26.5 * u.K, 0.415 * u.eV / u.cm ** 3]],
    Eemin=100 * u.GeV,
)

model = gm.NaimaSpectralModel(radiative_model, distance=1.5 * u.kpc)

opts = {
    "energy_range": [10 * u.GeV, 80 * u.TeV],
    "energy_power": 2,
    "flux_unit": "erg-1 cm-2 s-1",
}

# Plot the total inverse Compton emission
model.plot(label="IC (total)", **opts)

# Plot the separate contributions from each seed photon field
for seed, ls in zip(["CMB", "FIR"], ["-", "--"]):
    model = gm.NaimaSpectralModel(
        radiative_model, seed=seed, distance=1.5 * u.kpc
    )
    model.plot(label=f"IC ({seed})", ls=ls, color="gray", **opts)

plt.legend(loc="best")
WARNING: AstropyDeprecationWarning: astropy.extern.six will be removed in 4.0, use the six module directly if it is still needed [astropy.extern.six]
[6]:
<matplotlib.legend.Legend at 0x116d5d048>
[7]:
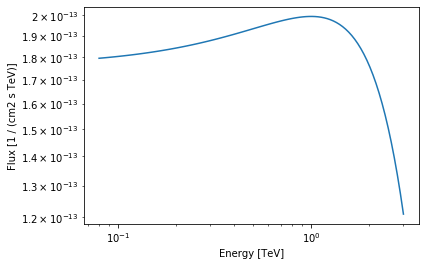
gaussian = gm.GaussianSpectralModel(mean="1 TeV")
gaussian.plot(energy_range)
[7]:
<matplotlib.axes._subplots.AxesSubplot at 0x116d64b00>
[ ]: