Pulsar Source Models
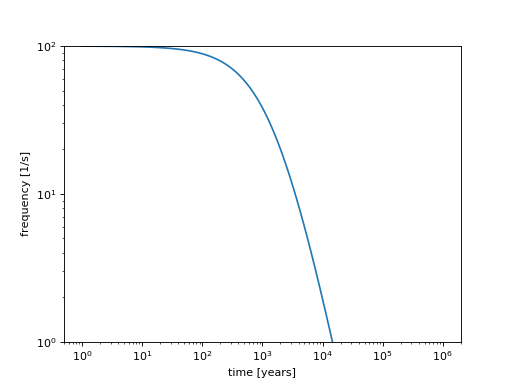
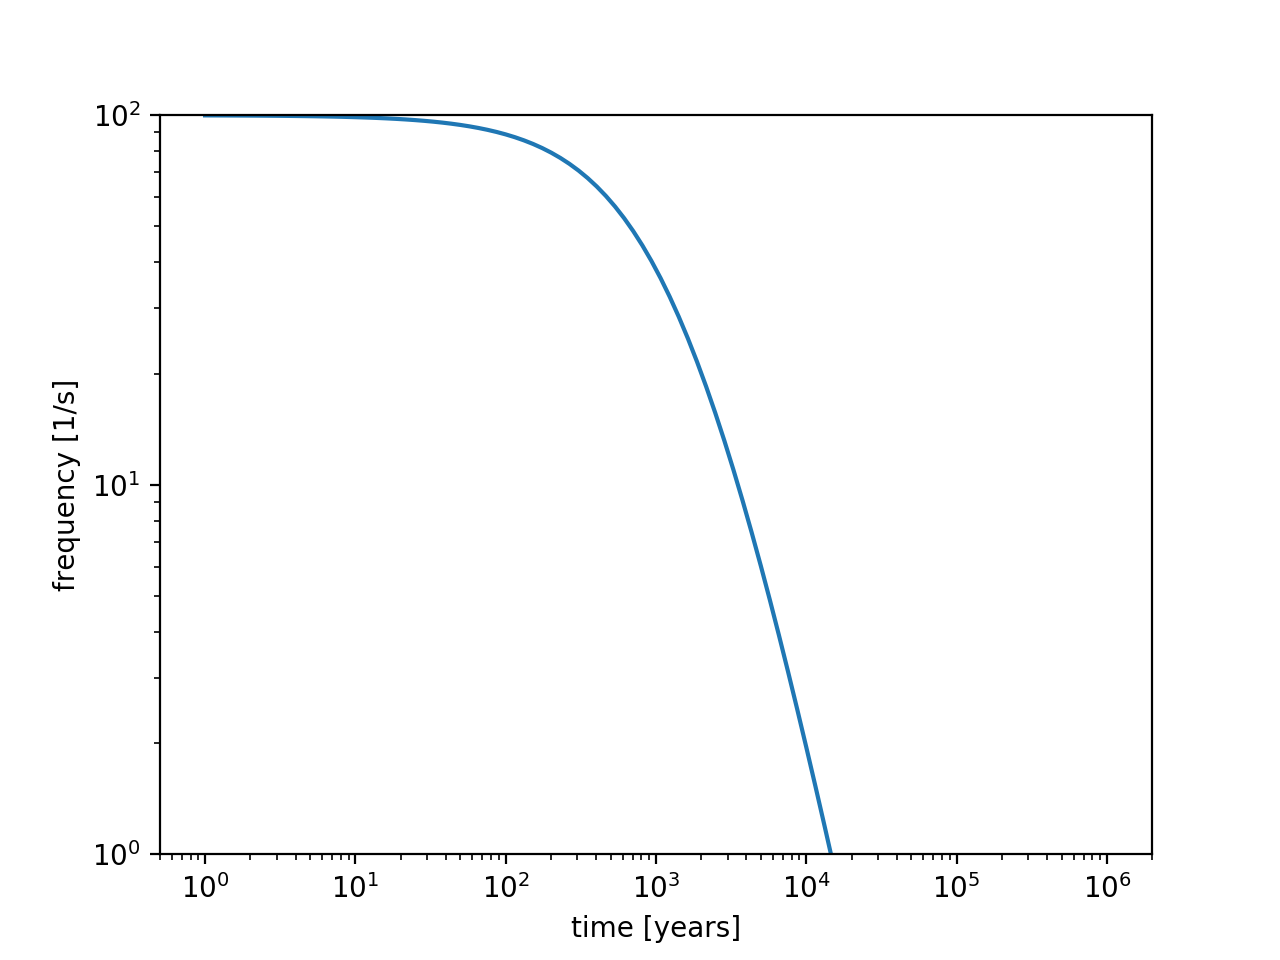
Plot spin frequency of the pulsar with time:
"""Plot spin frequency of the pulsar with time."""
import numpy as np
import matplotlib.pyplot as plt
from astropy.units import Quantity
from gammapy.astro.source import Pulsar

t = Quantity(np.logspace(0, 6, 100), "yr")

pulsar = Pulsar(P_0=Quantity(0.01, "s"), B="1e12 G")

plt.plot(t.value, 1 / pulsar.period(t).cgs.value)
plt.xlabel("time [years]")
plt.ylabel("frequency [1/s]")
plt.ylim(1e0, 1e2)
plt.loglog()
plt.show()
