Pulsar Wind Nebula Source Models
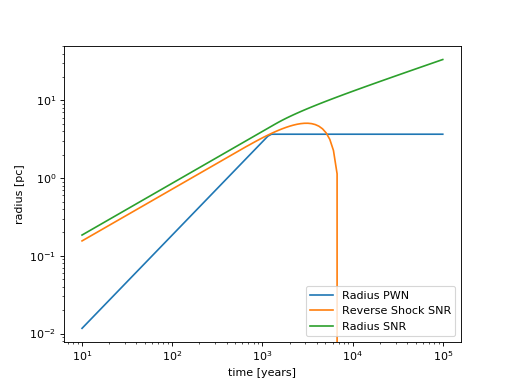
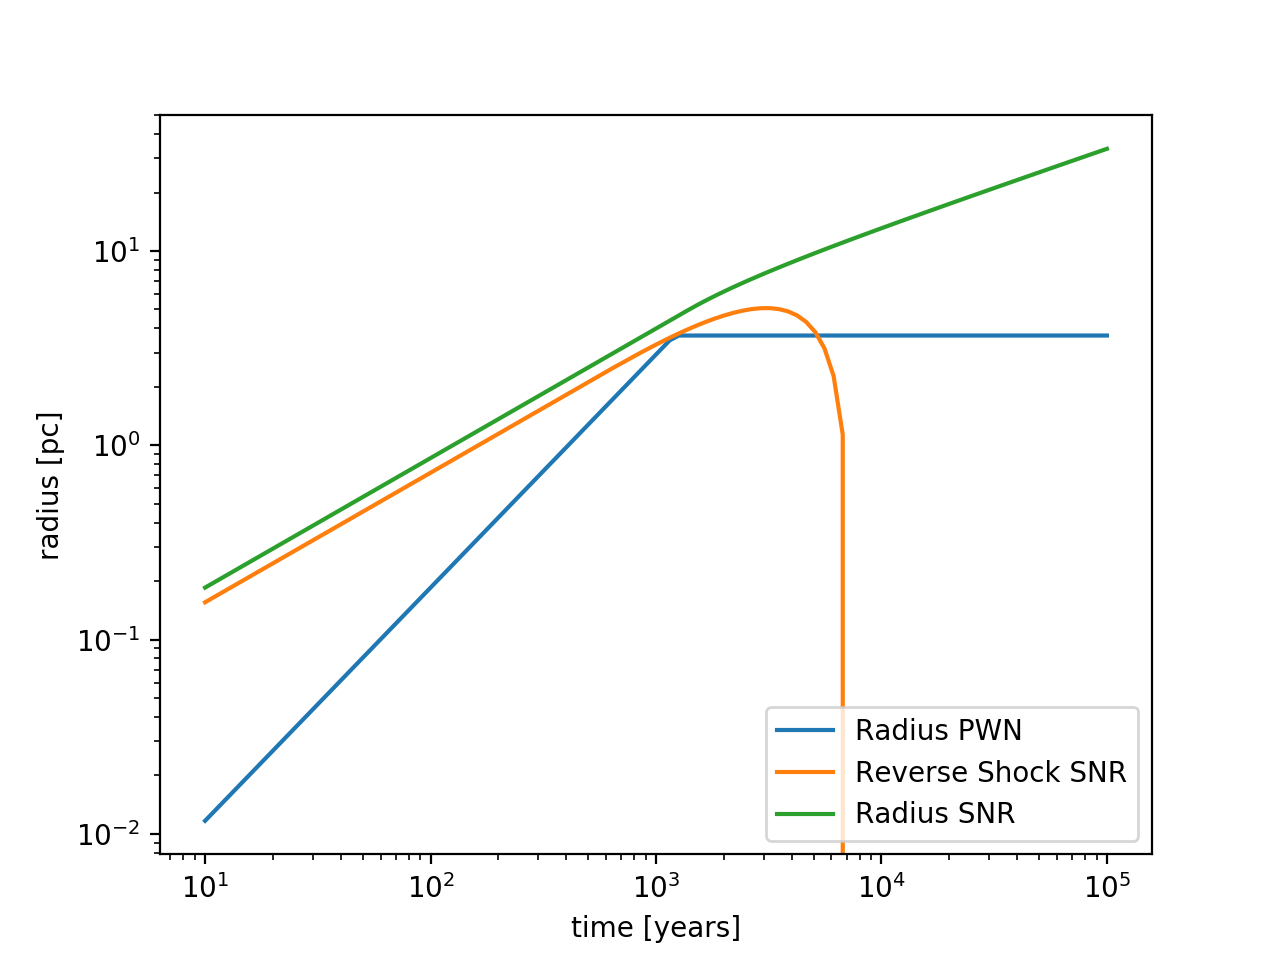
Plot the evolution of the radius of the PWN:
"""Plot PWN evolution with time."""
import numpy as np
import matplotlib.pyplot as plt
from astropy.units import Quantity
from astropy.constants import M_sun
from gammapy.astro.source import PWN, SNRTrueloveMcKee

t = Quantity(np.logspace(1, 5, 100), "yr")
n_ISM = Quantity(1, "cm^-3")
snr = SNRTrueloveMcKee(m_ejecta=8 * M_sun, n_ISM=n_ISM)
pwn = PWN(snr=snr)
pwn.pulsar.L_0 = Quantity(1e40, "erg/s")

plt.plot(t.value, pwn.radius(t).to("pc").value, label="Radius PWN")
plt.plot(t.value, snr.radius_reverse_shock(t).to("pc").value, label="Reverse Shock SNR")
plt.plot(t.value, snr.radius(t).to("pc").value, label="Radius SNR")

plt.xlabel("time [years]")
plt.ylabel("radius [pc]")
plt.legend(loc=4)
plt.loglog()
plt.show()
