Supernova Remnant Models
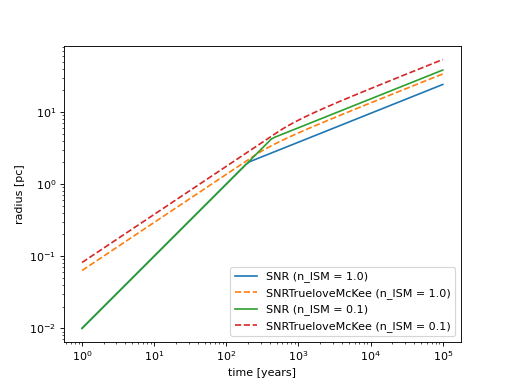
Plot the evolution of radius of the SNR:
"""Plot SNR radius evolution versus time."""
import numpy as np
from astropy.units import Quantity
import matplotlib.pyplot as plt
from gammapy.astro.source import SNR, SNRTrueloveMcKee

snr_models = [SNR, SNRTrueloveMcKee]
densities = Quantity([1, 0.1], "cm^-3")
linestyles = ["-", "--"]
t = Quantity(np.logspace(0, 5, 100), "yr")

for density in densities:
    for linestyle, snr_model in zip(linestyles, snr_models):
        snr = snr_model(n_ISM=density)
        label = snr.__class__.__name__ + " (n_ISM = {})".format(density.value)
        x = t.value
        y = snr.radius(t).to("pc").value
        plt.plot(x, y, label=label, linestyle=linestyle)

plt.xlabel("time [years]")
plt.ylabel("radius [pc]")
plt.legend(loc=4)
plt.loglog()
plt.show()

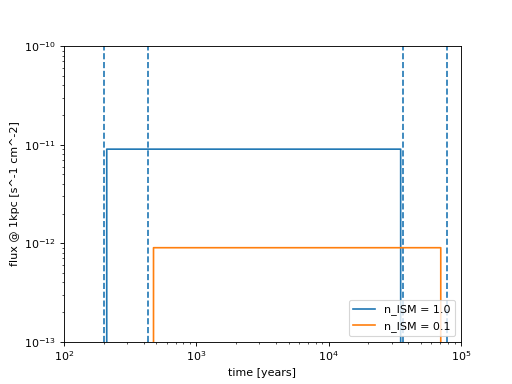
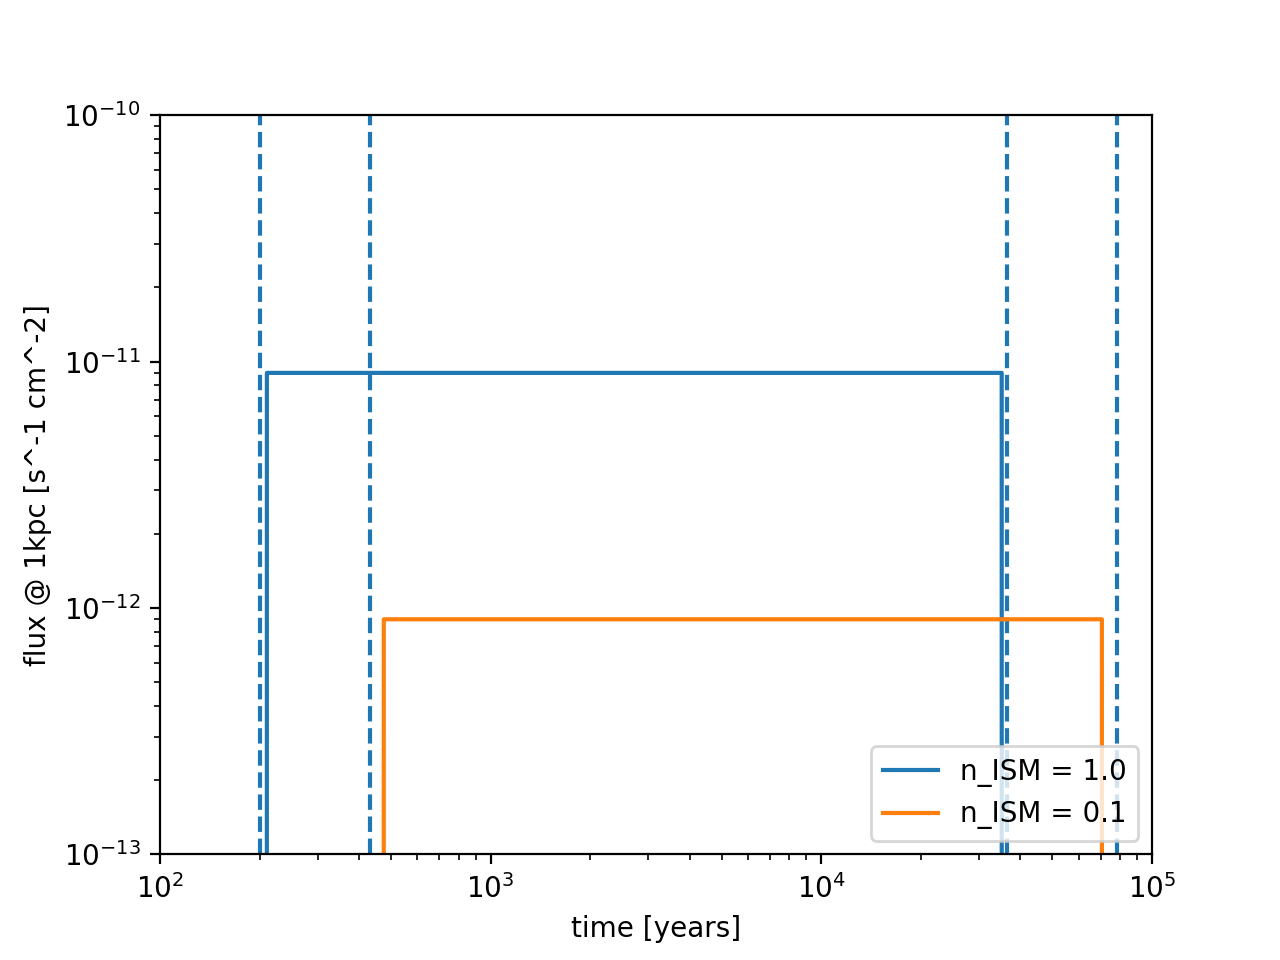
Plot the evolution of the flux of the SNR above 1 TeV and at 1 kpc distance:
"""Plot SNR brightness evolution."""
import numpy as np
from astropy.units import Quantity
import matplotlib.pyplot as plt
from gammapy.astro.source import SNR

densities = Quantity([1, 0.1], "cm-3")
t = Quantity(np.logspace(0, 5, 100), "yr")

for density in densities:
    snr = SNR(n_ISM=density)
    F = snr.luminosity_tev(t) / (4 * np.pi * Quantity(1, "kpc") ** 2)
    plt.plot(t.value, F.to("cm-2 s-1").value, label="n_ISM = {}".format(density.value))
    plt.vlines(snr.sedov_taylor_begin.to("yr").value, 1e-13, 1e-10, linestyle="--")
    plt.vlines(snr.sedov_taylor_end.to("yr").value, 1e-13, 1e-10, linestyle="--")

plt.xlim(1e2, 1e5)
plt.ylim(1e-13, 1e-10)
plt.xlabel("time [years]")
plt.ylabel("flux @ 1kpc [s^-1 cm^-2]")
plt.legend(loc=4)
plt.loglog()
plt.show()