Note
Click here to download the full example code
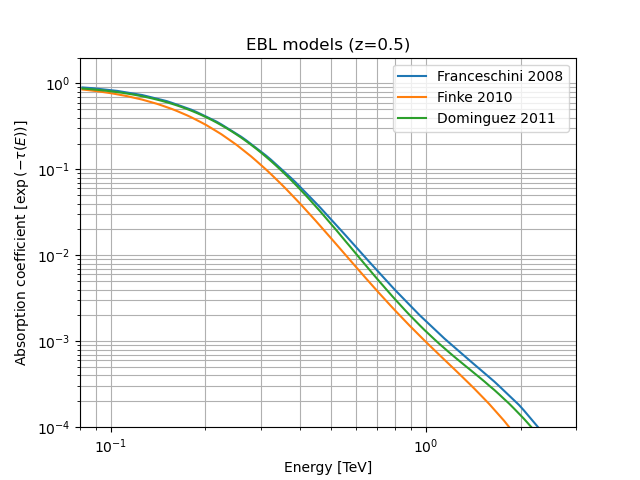
EBL absorbption spectral model
This model evaluates absorbed spectral model.
The EBL absorption factor given by
\[\exp{ \left ( -\alpha \times \tau(E, z) \right )}\]
where \(\tau(E, z)\) is the optical depth predicted by the model
(Absorption), which depends on the energy of the gamma-rays and the
redshift z of the source, and \(\alpha\) is a scale factor
(default: 1) for the optical depth.
Example plot
Here is an example plot of the model:
from astropy import units as u
import matplotlib.pyplot as plt
from gammapy.modeling.models import (
EBLAbsorptionNormSpectralModel,
Models,
PowerLawSpectralModel,
SkyModel,
)
# Here we illustrate how to create and plot EBL absorption models for a redshift of 0.5
# sphinx_gallery_thumbnail_number = 1
redshift = 0.5
dominguez = EBLAbsorptionNormSpectralModel.read_builtin("dominguez", redshift=redshift)
franceschini = EBLAbsorptionNormSpectralModel.read_builtin(
"franceschini", redshift=redshift
)
finke = EBLAbsorptionNormSpectralModel.read_builtin("finke", redshift=redshift)
plt.figure()
energy_bounds = [0.08, 3] * u.TeV
opts = dict(energy_bounds=energy_bounds, xunits=u.TeV)
franceschini.plot(label="Franceschini 2008", **opts)
finke.plot(label="Finke 2010", **opts)
dominguez.plot(label="Dominguez 2011", **opts)
plt.ylabel(r"Absorption coefficient [$\exp{(-\tau(E))}$]")
plt.xlim(energy_bounds.value)
plt.ylim(1e-4, 2)
plt.title(f"EBL models (z={redshift})")
plt.grid(which="both")
plt.legend(loc="best")
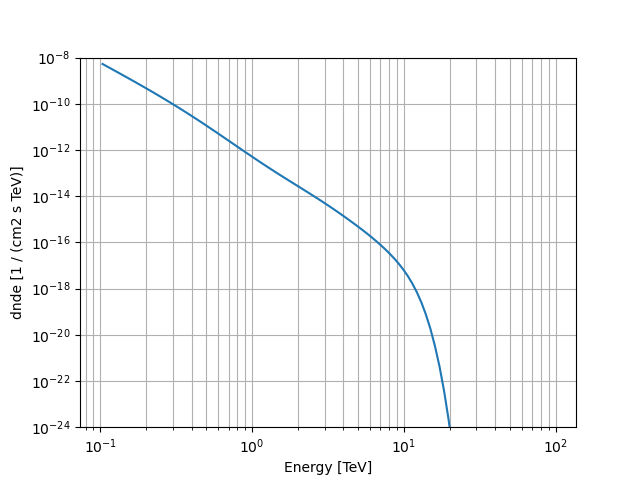
# Spectral model corresponding to PKS 2155-304 (quiescent state)
index = 3.53
amplitude = 1.81 * 1e-12 * u.Unit("cm-2 s-1 TeV-1")
reference = 1 * u.TeV
pwl = PowerLawSpectralModel(index=index, amplitude=amplitude, reference=reference)
# The power-law model is multiplied by the EBL norm spectral model
redshift = 0.117
absorption = EBLAbsorptionNormSpectralModel.read_builtin("dominguez", redshift=redshift)
model = pwl * absorption
energy_bounds = [0.1, 100] * u.TeV
plt.figure()
model.plot(energy_bounds)
plt.grid(which="both")
plt.ylim(1e-24, 1e-8)
YAML representation
Here is an example YAML file using the model:
Out:
components:
-   name: absorbed-model
    type: SkyModel
    spectral:
        type: CompoundSpectralModel
        model1:
            type: PowerLawSpectralModel
            parameters:
            -   name: index
                value: 3.53
            -   name: amplitude
                value: 1.81e-12
                unit: cm-2 s-1 TeV-1
            -   name: reference
                value: 1.0
                unit: TeV
                frozen: true
        model2:
            type: EBLAbsorptionNormSpectralModel
            parameters:
            -   name: alpha_norm
                value: 1.0
                frozen: true
            -   name: redshift
                value: 0.117
                frozen: true
            filename: /Users/adonath/github/gammapy/gammapy-data/ebl/ebl_dominguez11.fits.gz
        operator: mul