Note
Go to the end to download the full example code. or to run this example in your browser via Binder
Make a theta-square plot#
This tutorial explains how to make such a plot, that is the distribution of event counts as a function of the squared angular distance, to a test position.
Setup#
# %matplotlib inline
import matplotlib.pyplot as plt
from astropy.coordinates import SkyCoord
from astropy import units as u
from gammapy.data import DataStore
from gammapy.maps import MapAxis
from gammapy.makers.utils import make_theta_squared_table
from gammapy.visualization import plot_theta_squared_table
Check setup#
from gammapy.utils.check import check_tutorials_setup

check_tutorials_setup()
System:

        python_executable      : /home/runner/work/gammapy-docs/gammapy-docs/gammapy/.tox/build_docs/bin/python
        python_version         : 3.9.22
        machine                : x86_64
        system                 : Linux


Gammapy package:

        version                : 2.0.dev1305+g5f0ae82af
        path                   : /home/runner/work/gammapy-docs/gammapy-docs/gammapy/.tox/build_docs/lib/python3.9/site-packages/gammapy


Other packages:

        numpy                  : 1.26.4
        scipy                  : 1.13.1
        astropy                : 6.0.1
        regions                : 0.8
        click                  : 8.1.8
        yaml                   : 6.0.2
        IPython                : 8.18.1
        jupyterlab             : not installed
        matplotlib             : 3.9.4
        pandas                 : not installed
        healpy                 : 1.17.3
        iminuit                : 2.31.1
        sherpa                 : 4.16.1
        naima                  : 0.10.0
        emcee                  : 3.1.6
        corner                 : 2.2.3
        ray                    : 2.46.0


Gammapy environment variables:

        GAMMAPY_DATA           : /home/runner/work/gammapy-docs/gammapy-docs/gammapy-datasets/dev
Get some data#
Some data taken on the Crab by H.E.S.S. are used.
data_store = DataStore.from_dir("$GAMMAPY_DATA/hess-dl3-dr1")
observations = data_store.get_observations([23523, 23526])
Define a test position#
position = SkyCoord.from_name("crab")
print(position)
<SkyCoord (ICRS): (ra, dec) in deg
    (83.6324, 22.0174)>
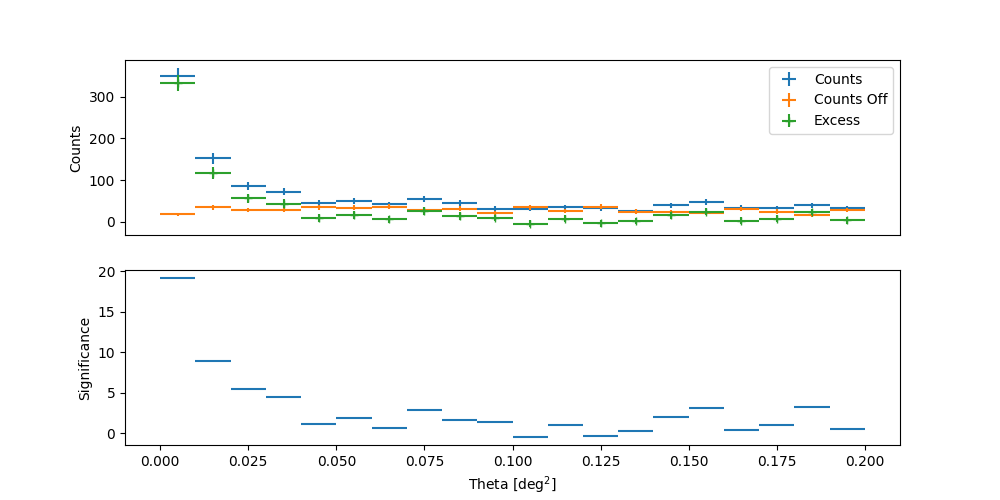
Creation of the theta2 plot#
theta2_axis = MapAxis.from_bounds(0, 0.2, nbin=20, interp="lin", unit="deg2")
theta2_table = make_theta_squared_table(
    observations=observations,
    position=position,
    theta_squared_axis=theta2_axis,
)

plt.figure(figsize=(10, 5))
plot_theta_squared_table(theta2_table)
plt.show()
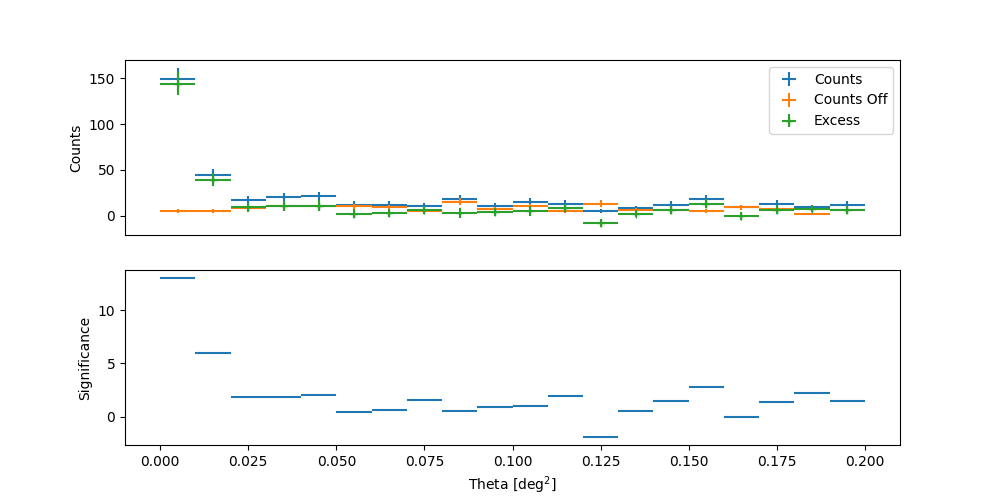
Making a theta2 plot for a given energy range#
with the function make_theta_squared_table, one can also select a fixed energy range.
theta2_table_en = make_theta_squared_table(
    observations=observations,
    position=position,
    theta_squared_axis=theta2_axis,
    energy_edges=[1.2, 11] * u.TeV,
)
plt.figure(figsize=(10, 5))
plot_theta_squared_table(theta2_table_en)
plt.show()
Statistical significance of a detection#
To get the significance of a signal, the usual method consists of using the reflected background method (see the maker tutorial: Reflected regions background) to compute the WStat statistics (see WStat : Poisson data with background measurement, Fit statistics). This is the well-known method of Li&Ma [LiMa1983] using ON and OFF regions. The following tutorials show how to get an excess significance: